
Exchangeable Sodium Fell 71% Over Two Years
Marlborough Vineyard Soil Function Case Study
Independent laboratory testing recorded exchangeable sodium falling from 2.44 to 0.70 me/100 g over approximately two years — while the grower reported better drainage in previously tight areas of the vineyard.
This was a low-lying coastal vineyard with a high water table and areas of poor drainage.
A DCT programme including Optimise was introduced.
Over the following two years, three soil tests from the same vineyard area recorded a clear progression:
Exchangeable Sodium
2.44 → 1.34 → 0.70 me/100 g
That's approximately:
71% Lower
But sodium alone doesn't tell the whole story.
When the sodium results are considered against the soil's measured Cation Exchange Capacity (CEC), calculated Exchangeable Sodium Percentage (ESP) moved:
12.2% → 6.7% → 3.0%
During the same period, the grower reported improved drainage and observed improvement in root development and soil condition.
The Starting Point
The vineyard sits in an environment where water and soil movement matter.
The property is:
low lying
close to the coast
and affected by a:
high water table
Neighbouring properties had also shown visible signs consistent with salt-affected soils.
Within the vineyard, some areas were tight and poorly drained.
The initial soil test recorded:
Exchangeable sodium — 2.44 me/100 g
CEC — 20 me/100 g
This gives a calculated ESP of:
12.2%
In simple terms, sodium occupied a substantial proportion of the soil's measured exchange capacity.
That matters because excessive exchangeable sodium can affect the way susceptible soils hold together, reducing pore space and making it harder for water and roots to move through the soil.
What Happened?
A DCT soil and vine programme including Optimise was used.
The soil was subsequently tested at approximately yearly intervals.
Starting Point
Exchangeable sodium — 2.44 me/100 g
CEC — 20 me/100 g
Calculated ESP — 12.2%
Approximately 1 Year
Exchangeable sodium — 1.34 me/100 g
CEC — 20 me/100 g
Calculated ESP — 6.7%
Approximately 2 Years
Exchangeable sodium — 0.70 me/100 g
CEC — 23 me/100 g
Calculated ESP — 3.0%
The important part is the progression.
2.44 → 1.34 → 0.70
This wasn't a single before-and-after measurement.
Exchangeable sodium moved progressively lower across three independent laboratory soil tests over approximately two years.
The Actual Soil-Test Evidence
Starting Soil Test
Sodium — 2.44 me/100 g
Approximately 1 Year
Sodium — 1.34 me/100 g
These aren't illustrative images.
They are images of the historical laboratory soil tests behind the results reported on this page.
Approximately 2 Years
Sodium — 0.70 me/100 g
More Than Sodium Was Changing
The wider soil-test results make this case particularly interesting.
Across the same three tests:
Exchangeable Sodium
2.44 → 1.34 → 0.70 me/100 g
Calcium
10.9 → 10.9 → 13.5 me/100 g
Magnesium
4.68 → 4.19 → 3.78 me/100 g
Potassium
0.48 → 0.38 → 0.53 me/100 g
CEC
20 → 20 → 23 me/100 g
pH
6.8 → 6.4 → 6.2
The soil wasn't simply producing one different number.
The balance of the exchange complex was changing.
Most importantly for this case, sodium became progressively less dominant.
Why Does That Matter?
Soil isn't simply a container for nutrients.
Its exchange sites hold positively charged elements such as calcium, magnesium, potassium and sodium.
The balance between them can influence the way the soil functions.
Where exchangeable sodium becomes excessive in susceptible soils, clay particles can swell and disperse.
That can interfere with the pore spaces needed to move:
water
air
and:
roots
through the soil.
The practical symptoms can include poor infiltration, restricted drainage, surface sealing and difficult root-zone conditions.
That makes what happened in this vineyard particularly relevant.
Exchangeable sodium fell.
ESP fell.
And during the same period:
The grower reported better drainage.
What Could Explain the Change?
There is a well-established soil-chemistry pathway that makes the result particularly interesting.
Calcium and sodium compete for positions on the soil's exchange complex.
Where sodium is displaced from exchange sites into soil solution, it has the potential to move with water through the soil profile.
Across this vineyard's soil tests, sodium moved:
2.44 → 0.70 me/100 g
while calcium ultimately moved:
10.9 → 13.5 me/100 g
At the same time, the grower was reporting improved drainage.
That gives us a scientifically credible explanation for how the changes could be connected.
The historical testing didn't track sodium through the soil profile or measure drainage water, so we can't establish the precise mechanism retrospectively.
But we don't need to invent one to recognise the significance of what was measured.
From 12.2% to 3.0%
Looking at ESP makes the scale of the change easier to understand.
At the beginning:
ESP — 12.2%
After approximately one year:
ESP — 6.7%
After approximately two years:
ESP — 3.0%
So sodium went from occupying approximately 12.2% of the measured exchange capacity to around 3.0%.
And importantly, the first year's improvement wasn't created by an increase in CEC.
CEC remained at 20 while exchangeable sodium fell from 2.44 to 1.34.
By year two, CEC had increased to 23, while sodium had fallen further to 0.70.
The underlying sodium measurement itself had genuinely and progressively declined.
What Was Happening Above the Numbers?
Laboratory testing tells us what happened chemically.
The grower's observations tell us what was happening practically.
During the same period, the grower reported:
Improved Drainage
in previously tight areas.
Improvement in root development and soil condition was also observed.
We don't have retained numerical measurements for root depth or infiltration, so those remain field observations rather than quantified results.
But they are relevant because they occurred alongside a substantial measured change in the soil's sodium status.
The Four Pillars
DCT looks at agricultural performance through four connected areas:
Soil Function. Root Development. Nutrient Efficiency. Plant Performance.
In this case, Soil Function is the clearest starting point.
Soil Function
Measured
Exchangeable sodium:
2.44 → 1.34 → 0.70
Calculated ESP:
12.2% → 6.7% → 3.0%
The grower also reported improved drainage.
Root Development
Observed
Improvement in root development was observed during the programme, although root depth wasn't numerically measured.
Nutrient Efficiency
Relevant
The balance of cations on the soil exchange complex changed substantially.
This matters to nutrient behaviour, although nutrient-use efficiency itself wasn't directly measured.
Plant Performance
Relevant, Not Quantified
Better root-zone conditions can support vine performance, but we don't hold sufficient historical yield or fruit-quality data to turn that into a measured result from this case.
What Makes This Case Important?
It's not simply that sodium was lower at the end.
It's the consistency of the progression.
Independent Laboratory Testing
2.44 → 1.34 → 0.70 me/100 g
Calculated ESP
12.2% → 6.7% → 3.0%
Calcium
10.9 → 10.9 → 13.5 me/100 g
Grower Observation
Improved Drainage
Period
Approximately Two Years
The result occurred during a DCT programme designed to improve the conditions around soil function, roots and nutrient performance.
We can measure the change.
We can see that it progressed over time.
And there are established soil processes that provide a credible explanation for how a change like this can occur.
What we don't do is turn that explanation into a mechanism we didn't directly measure.
Better Farming Starts With Better Understanding
A difficult area of a low-lying Marlborough vineyard started with exchangeable sodium at:
2.44 me/100 g
Approximately two years later:
0.70 me/100 g
Calculated ESP moved:
12.2% → 3.0%
And during that period, the grower reported that drainage improved.
For a grower dealing with tight, poorly draining or sodium-affected soils, that's the part of this case that matters.
Not simply that a laboratory number changed.
But that measurable soil chemistry and what the grower was seeing in the field were moving in the same direction.
Better soil performance starts with understanding what is holding it back.
Concerned About Sodium or Poor Drainage?
If parts of your property are struggling with drainage, soil structure or elevated sodium, DCT can help you investigate what's happening beneath the surface.

Continue Exploring the other foundations:
-
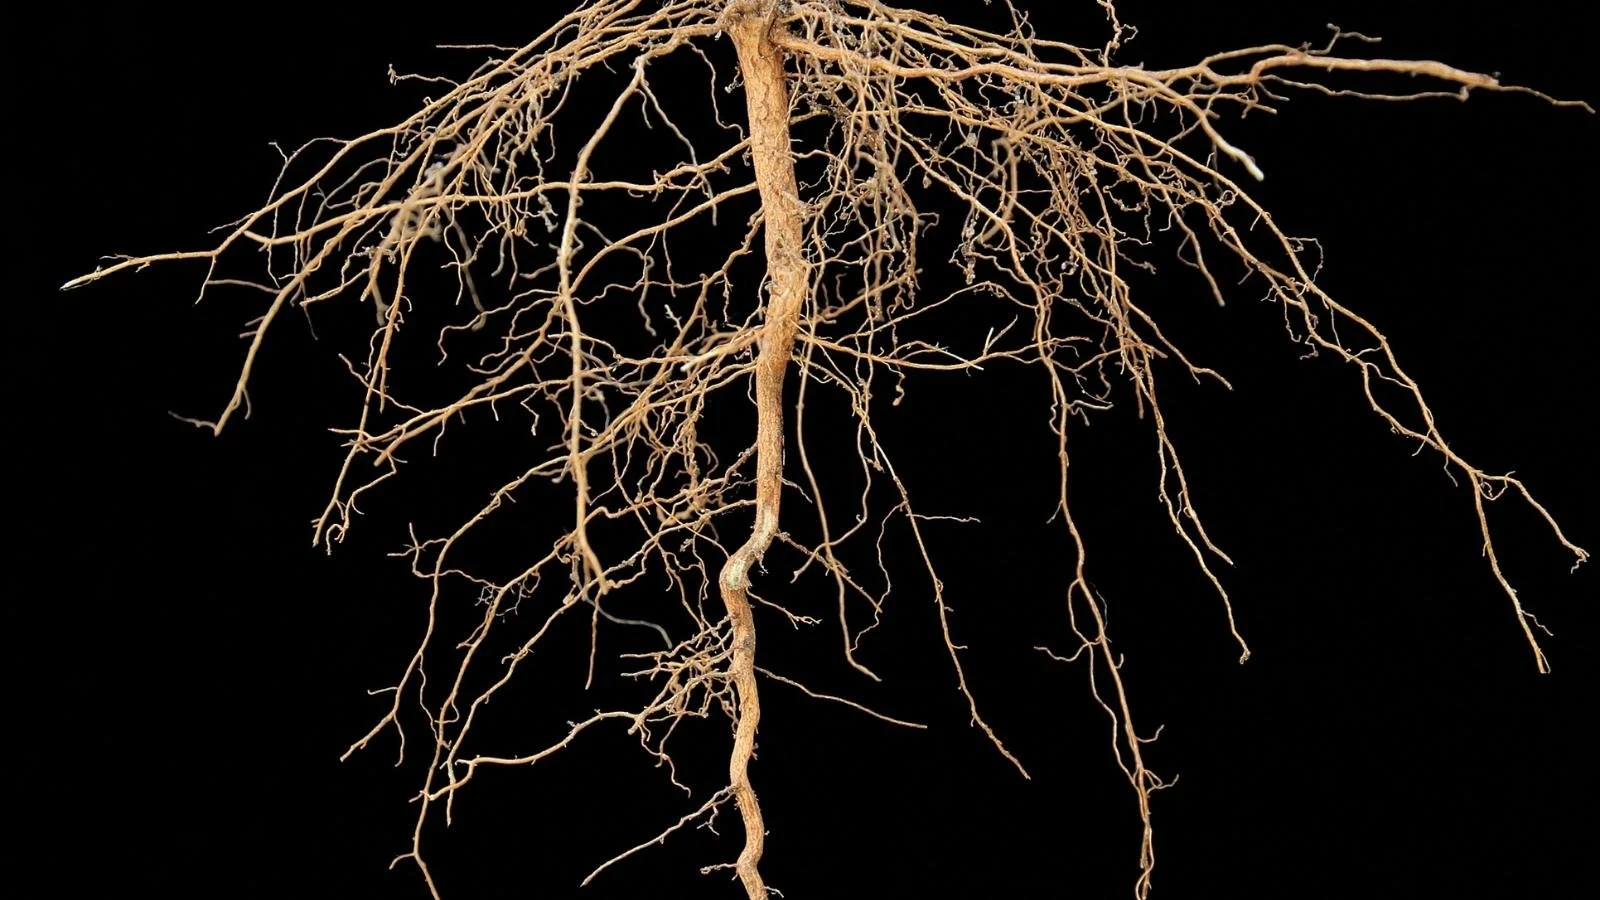
Root Development
Understanding how plants explore the soil for water and nutrients.
-
Soil Function
Understanding the environment where roots, water, nutrients and living processes interact.
-
Nutrient Efficiency
Understanding how farming systems capture and use available nutrients.
-
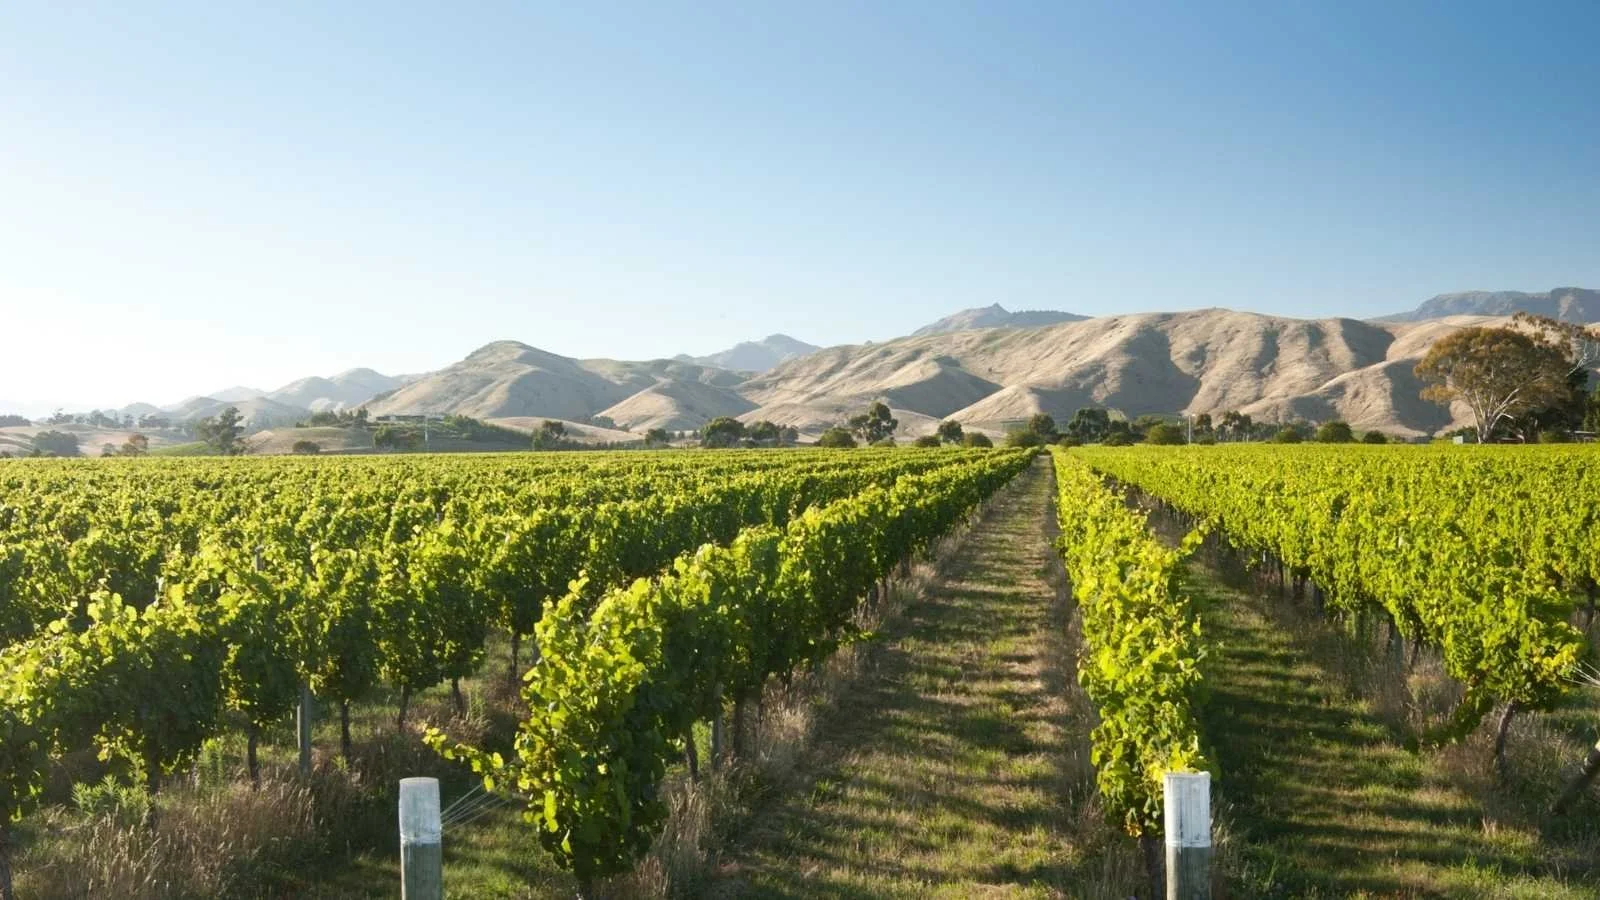
Plant Performance
Understanding how plants convert available resources into productive growth.