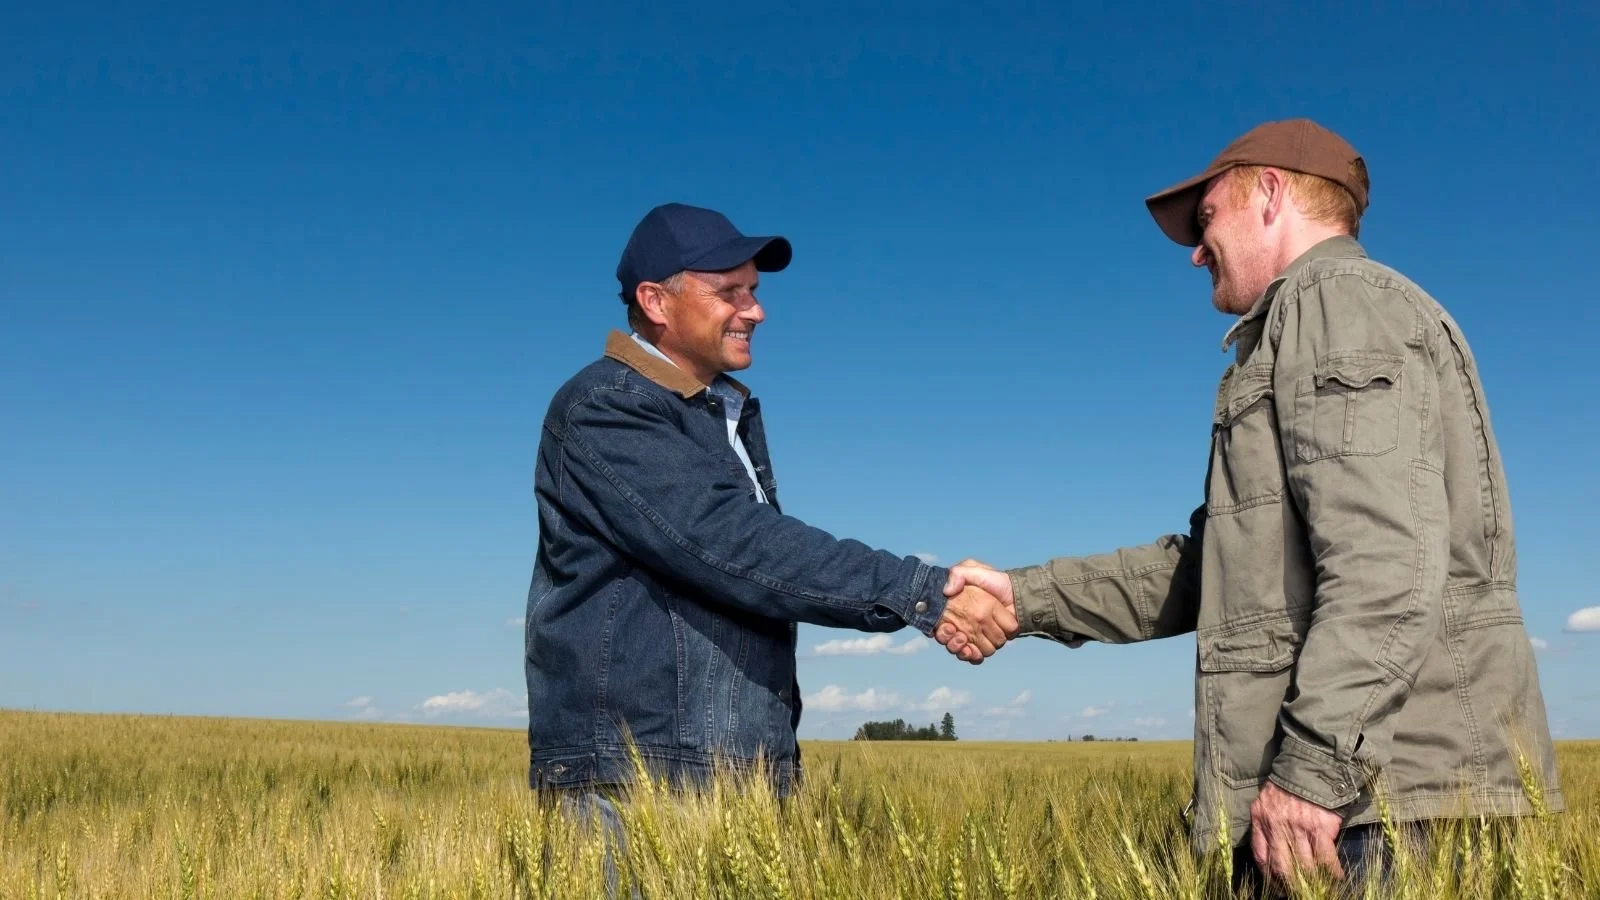
Case Studies & Grower Results
What Results Have New Zealand Farmers and Growers Seen With DCT?
These are results from real commercial farms, orchards and growing systems where DCT has actually been used.
Across the library you'll find independent laboratory testing, repeated paddock measurements, farm records, adviser calculations, field photographs and the experiences of farmers and growers themselves.
Not every result was measured in the same way — and we don't present it as though it was.
Measured. Calculated. Observed. Reported. We tell you which is which.
So What Actually Happened?
Nitrogen: ~300 → ~70 kg N/ha/year in one livestock system
Milk solids: 96,000 → 120,000 kg MS over three seasons on one dairy farm
Root depth: 62 → 105 mm average across 10 Canterbury paddocks
Clover: 10% → 17% average across the same 10 paddocks
Soil organic matter: 3.2% → 7.8% in independent laboratory testing
Exchangeable sodium: ↓ 71% over two years in independent soil testing
Pasture utilisation: 69% → 75% in farm back-calculations
Raspberry yield: 3 → 6 tonnes as reported by the grower
The Headline Is Only the Beginning.
Choose a result and see the evidence behind it.
Featured Results
-
Independent Testing. Recurring Farm Signals.
Across DCT’s commercial-farm testing archive spanning more than a decade, independent results reveal recurring signals in nitrogen retention and cycling, plant nitrogen status, root development, clover and carbon-related soil properties.
-
Three Farms. Three Seasons.
Across three Canterbury dairy farms with different soils, nitrogen inputs fell while recorded soil and root assessments improved over a three-season monitoring programme.
-
96,000 → 120,000 kg Milk Solids
Doug & Caroline increased milk solids over three consecutive seasons while nitrogen application reduced by approximately 55%.
Animal-health costs also reduced from approximately $90 to $48 per cow.
-
~300 → ~70 kg N/ha/year
Tristan reported substantially lower nitrogen use alongside a 15–17% increase in pasture utilisation and root depth increasing from less than 7 cm to more than 40 cm.
Explore the Case Study Library
-
Clover: 10% → 17%
Visually assessed across the same 10 Canterbury paddocks approximately one year apart.
-
“We Halved Our Fertiliser”
A Nelson market grower reported achieving the same results — if not better — with approximately half the fertiliser.
-
Pasture Utilisation: 69% → 75%
Three years of farm back-calculations also showed increasing milk solids attributed to home-grown forage.
-
Root Depth: 62 → 105 mm
Measured across 10 Canterbury paddocks over approximately one year — a 69% increase in average root depth.
-
Soil Structure Changed Over One Year
Before-and-after field assessments recorded visible changes in soil aggregation and structure in Canterbury pasture.
-
Organic Matter: 3.2% → 7.8%
Independent laboratory testing over approximately six months. An extraordinary result — and one worth looking at more closely.
-
Exchangeable Sodium ↓ 71%
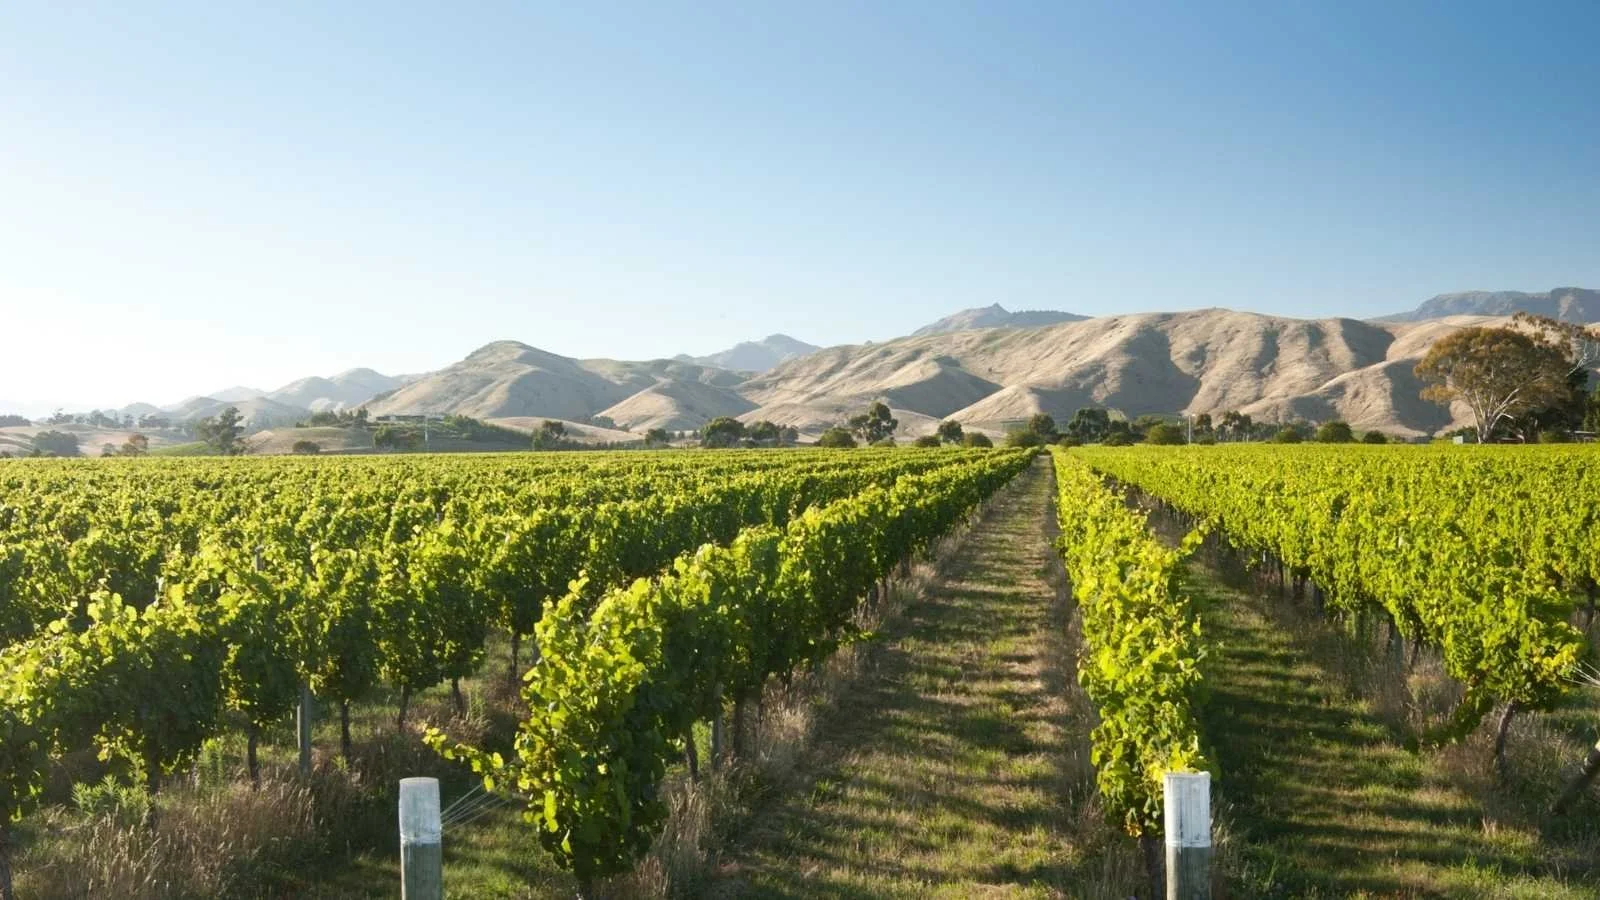
Independent soil testing over two years in a Marlborough vineyard, alongside reported improvements in drainage.
-
Pasture Mineral Profile Changed
Pasture testing approximately one year apart recorded substantial changes in magnesium, zinc, copper, selenium and calculated DCAD.
-
PiqaBoo Pears — “Never Looked So Good”
A Nelson orchard grower reported healthier-looking trees holding a strong crop after one season using DCT.
-
Onion Quality Improved
A historical Richmond field trial recorded maintained bulb size alongside firmer skins, stronger roots and reduced herbicide requirement.
-
Hops Growth & Crop Performance
A historical Tapawera field comparison recorded strong vine and bud development, with higher yield and quality reported at the time.
-
Raspberry Yield: 3 → 6 Tonnes
Grower-reported between consecutive seasons, alongside stronger canes, less harvest damage and improved drainage.
-
Grass Grub Populations Declined
A repeated field observation: dead and hardened grubs were documented at Nelson Lakes, with similar patterns observed elsewhere.
Different Results. A Connected System.
These cases come from different farms, soils, crops and seasons.
But the same four parts of the growing system keep appearing:
Root Development
Can the plant explore more of the soil profile?
Soil Function
Are soil conditions allowing roots, water and nutrients to function effectively?
Nutrient Efficiency
How much productive value are we getting from the nutrients already being applied?
Plant Performance
Is what changes below ground translating into something useful above it?
Soil. Roots. Nutrients. Plants.
They don't operate independently — and neither do we look at them that way.
Better Farming Starts With Better Understanding.
How We Present Our Results
Our case studies contain different types of evidence — from independent laboratory testing and field measurements to farm calculations and grower observations.
Where something was measured, we say it was measured. Where it was observed or reported, we say that instead.
These are commercial farming and growing systems, not identical controlled experiments. Results can vary with soil, climate, season, management and starting conditions.
Our aim is simple:
Show what changed. Show how we know. Let you decide whether it's worth investigating on your farm.
Want to Understand Why?
The case studies show what happened in the field.
Our science library looks at what established research can tell us about the processes behind soil function, root development, nutrient efficiency and plant performance — and where the science doesn't yet give us an answer.
Want to talk about what's happening in your system?
Continue Exploring the other foundations:
-
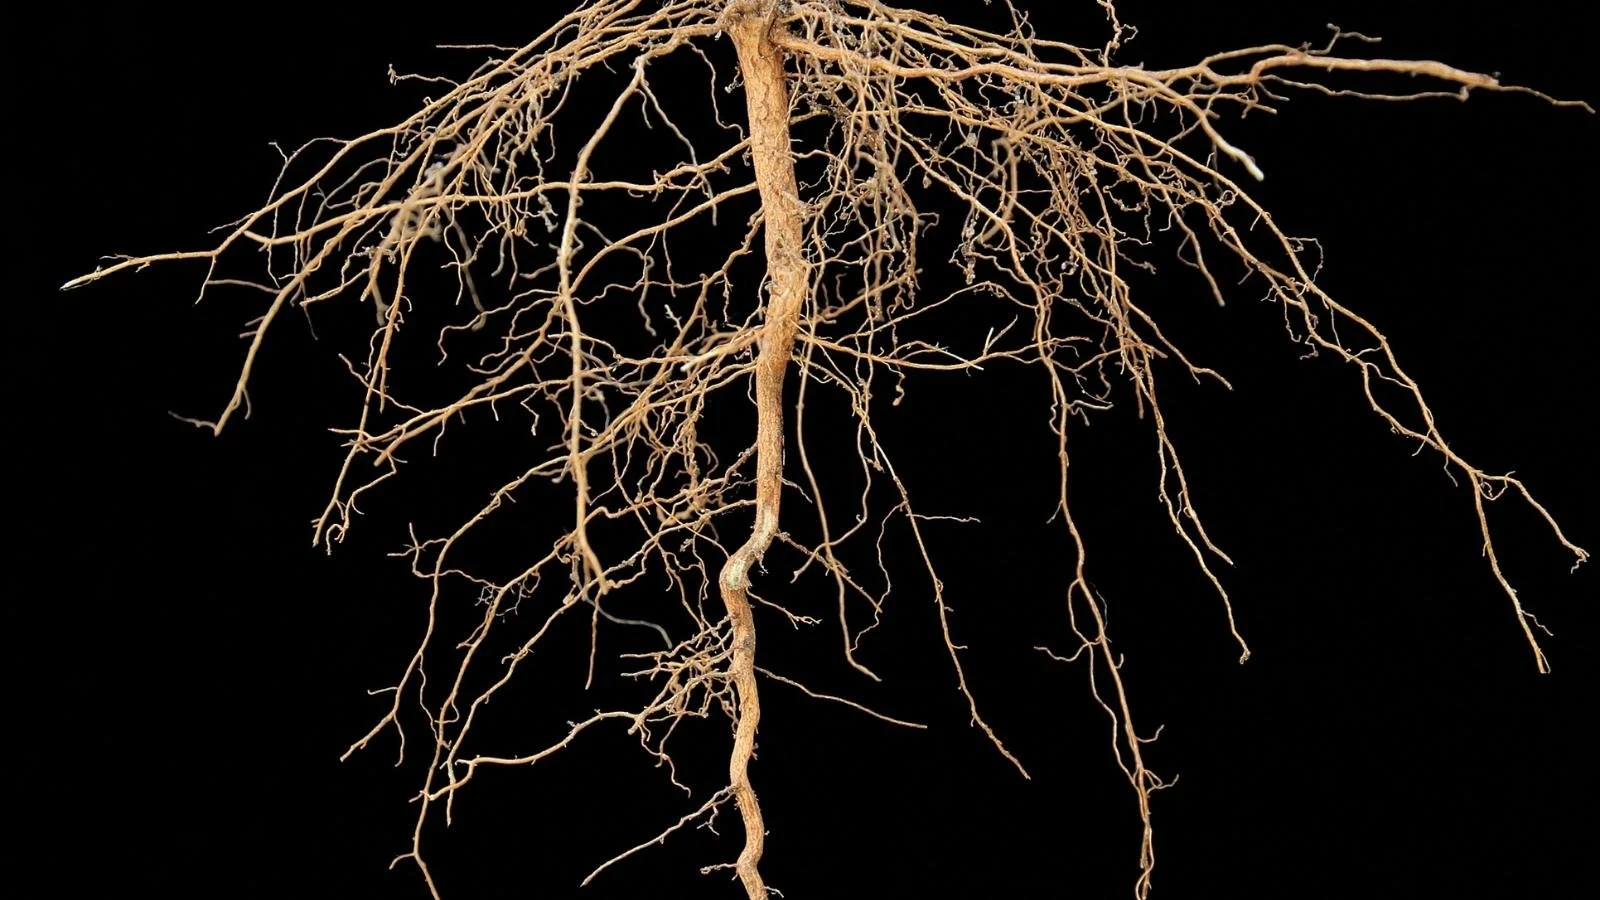
Root Development
Understanding how plants explore the soil for water and nutrients.
-
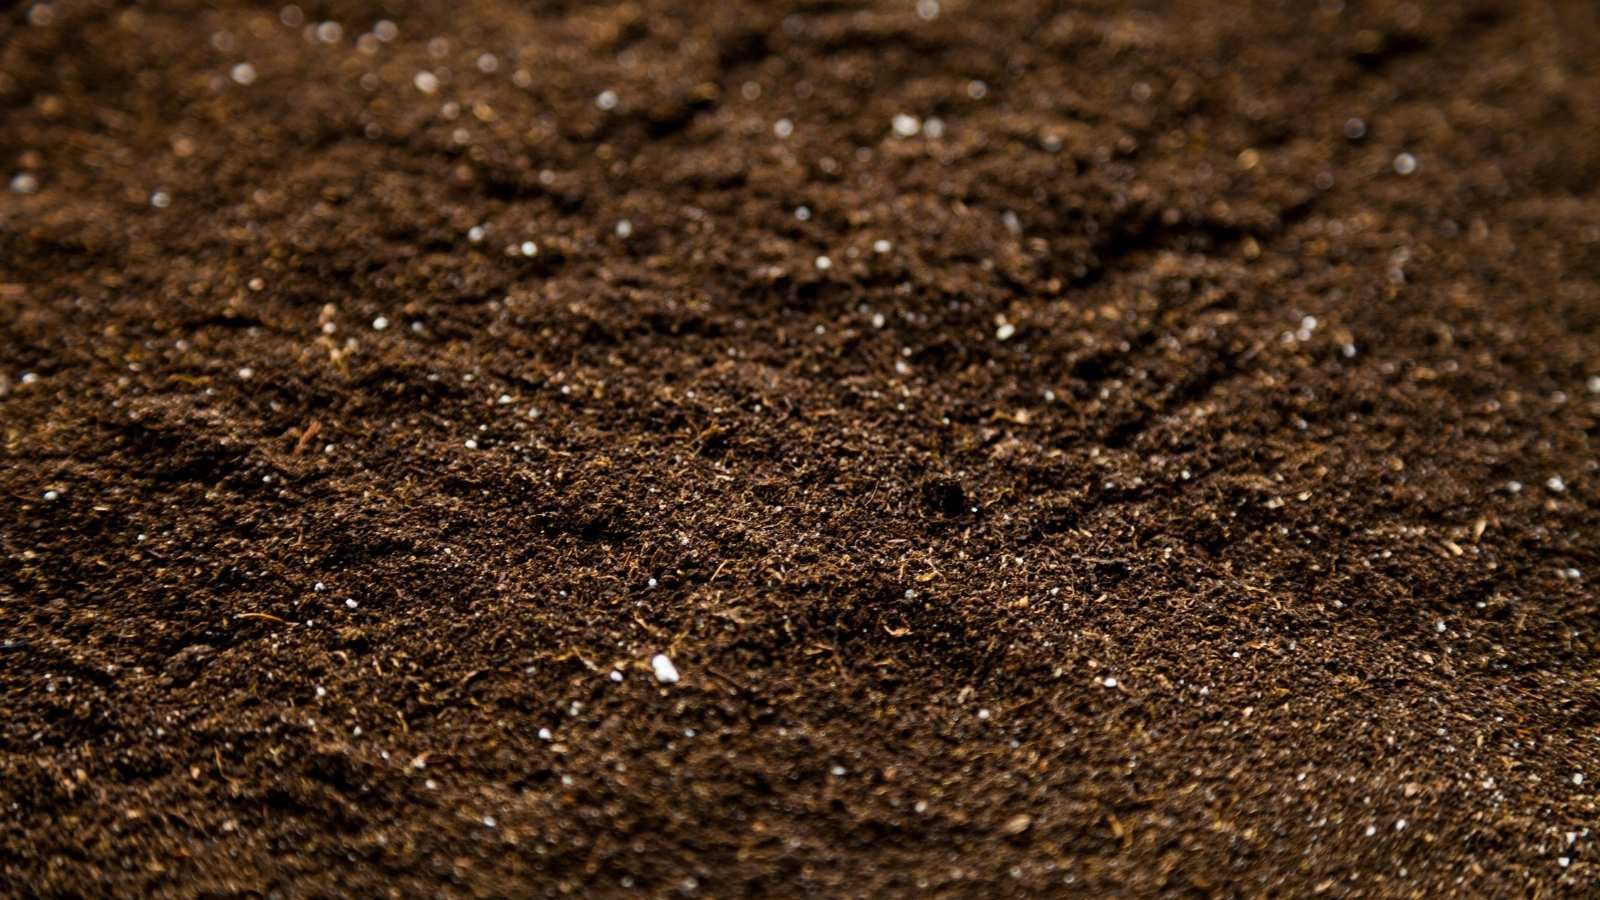
Soil Function
Understanding the environment where roots, water, nutrients and living processes interact.
-
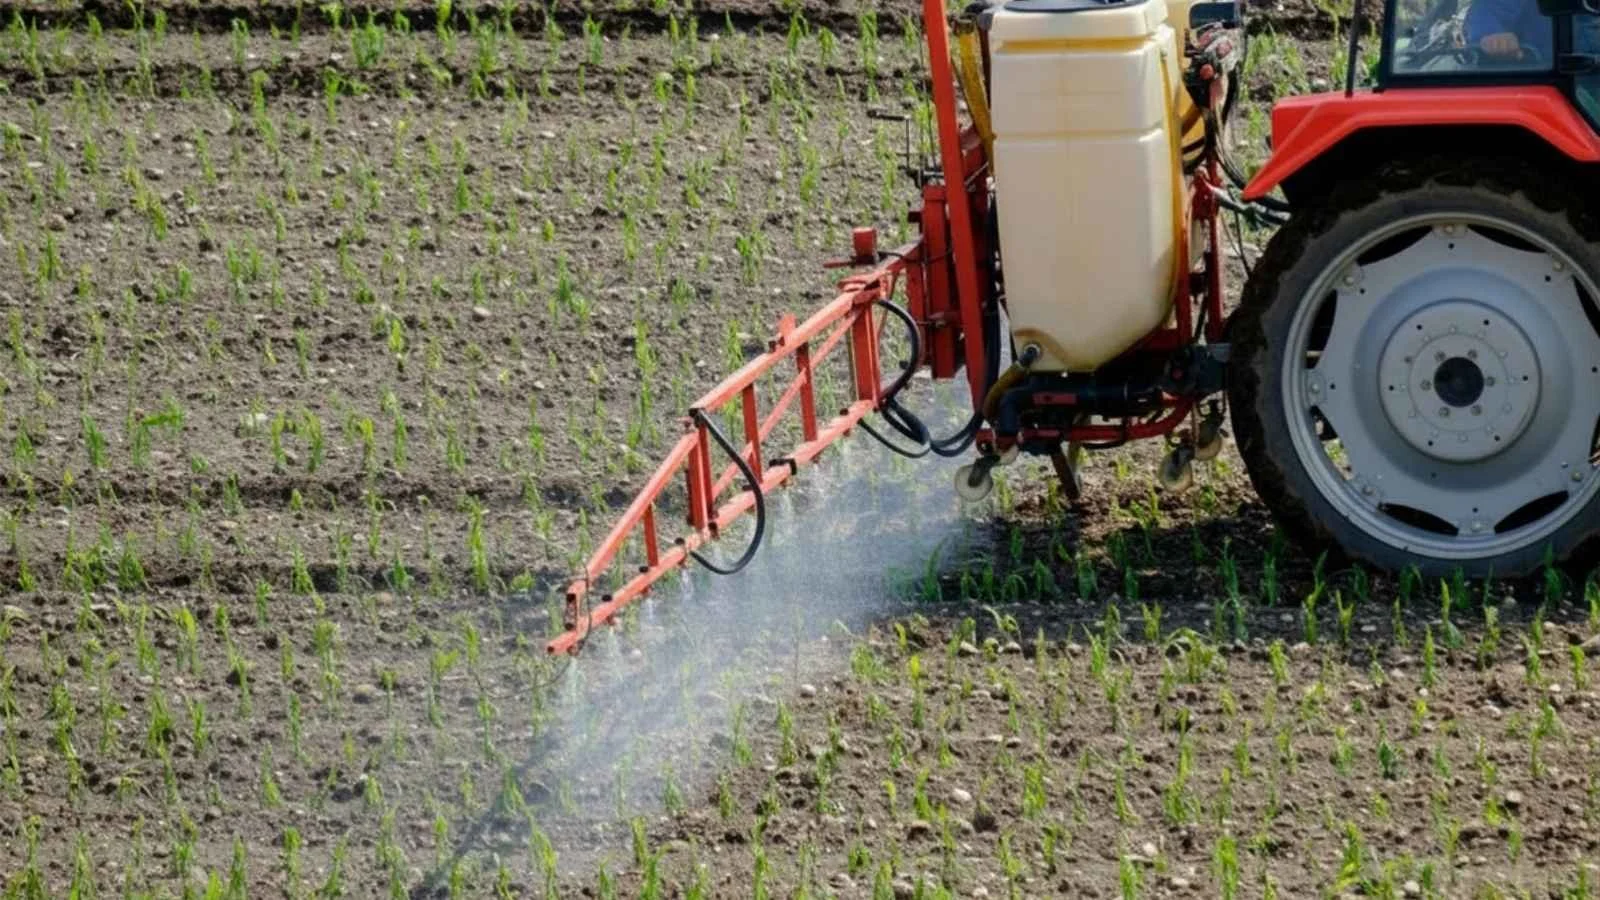
Nutrient Efficiency
Understanding how farming systems capture and use available nutrients.
-
Plant Performance
Understanding how plants convert available resources into productive growth.