Three Dairy Farms. Three Seasons. The Same Direction of Change.
Canterbury Dairy Monitoring Programme — New Zealand
Three commercial dairy farms with different soils were monitored over three seasons while using a DCT programme. Across all three farms, nitrogen inputs reduced while soil and root assessments improved.
One farm having a good season can be interesting.
Seeing a similar direction of change across three different commercial farms, over three seasons, tells us considerably more.
The Canterbury monitoring programme followed dairy farms at Leeston, Bankside and Oxford, ranging from approximately 200 to 500 effective hectares.
The farms differed in soil type and starting condition.
What they had in common was that DCT was incorporated into their existing farming systems and the changes were followed rather than simply recalled afterwards.
The monitoring included repeated visual soil assessments, root observations and measurements, photographs, some soil and herbage testing, and farm information including nitrogen use and production.
The Result at a Glance
Farm 1 — Leeston
Nitrogen input
Approx. 270 → 190 kg N/ha
Soil assessment
Approx. 12 → 24
Root depth and density
Improved
Farm 2 — Bankside
Nitrogen input
Approx. 280 → 190 kg N/ha
Soil assessment
Approx. 14 → 24
Root depth and density
Improved
Farm 3 — Oxford
Nitrogen input
Approx. 340 → 200 kg N/ha
Soil assessment
Approx. 14 → 24
Root depth and density
Improved
The individual farm summaries record broadly the same direction of change: lower nitrogen inputs alongside stronger soil and root assessments.
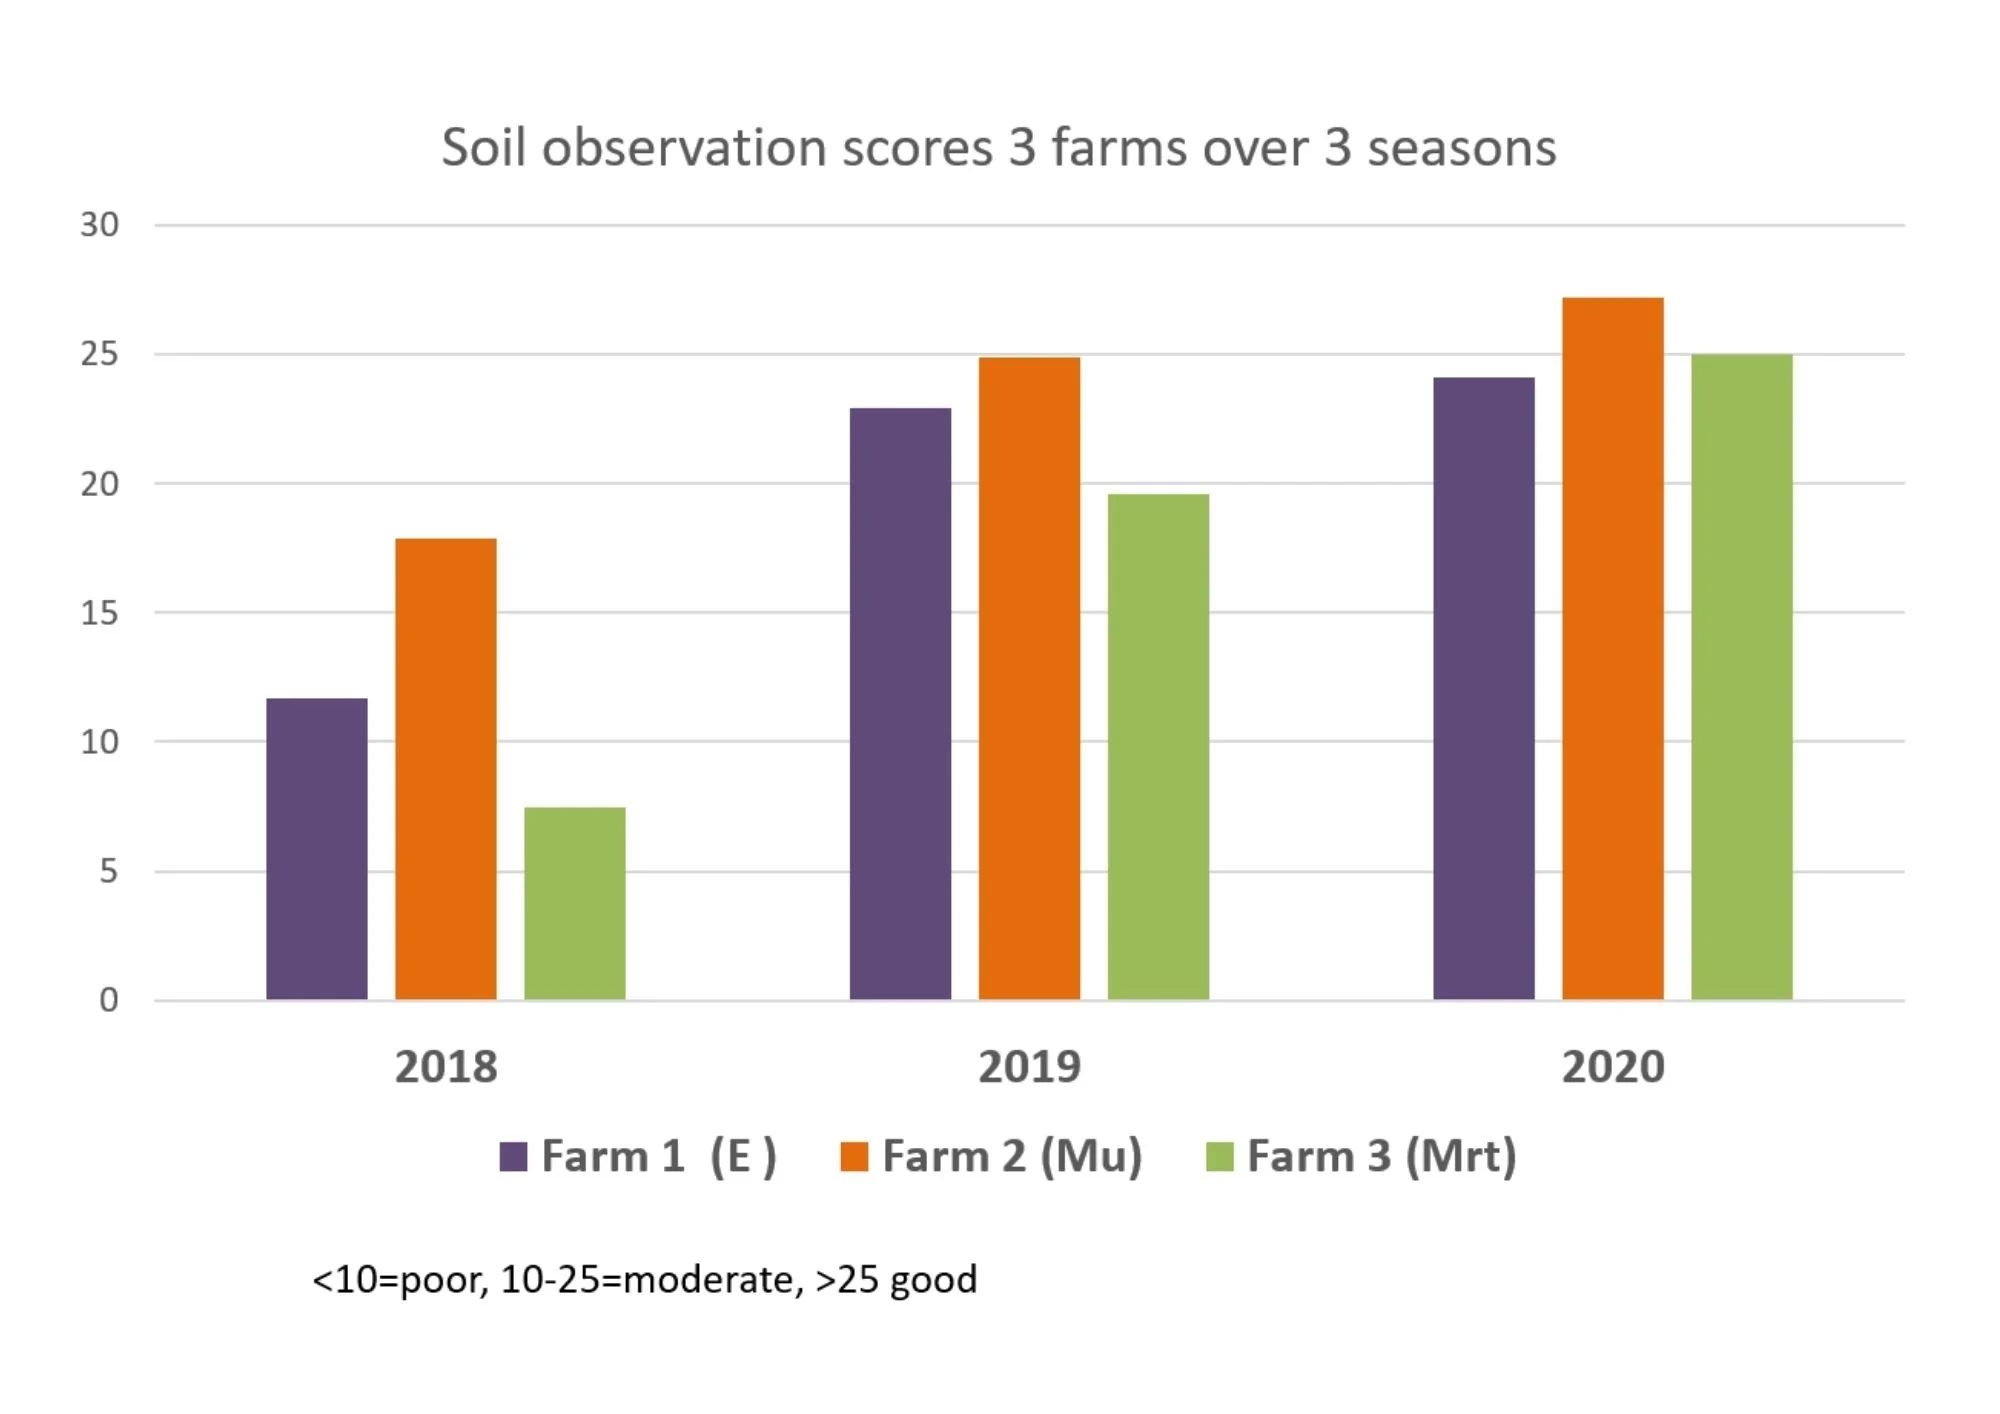
Visual soil-assessment scores across the three monitored Canterbury dairy farms over three seasons.
This Wasn't One Paddock
The programme followed a range of paddocks across the farms and reassessed them over time.
Visual Soil Assessment looked at characteristics including soil structure, porosity, colour and mottling, worm numbers, root length and density, root depth and surface condition.
The observations were recorded and accompanied by photographs so that changes could be compared through the programme.
That distinction matters.
This wasn't:
“The soil looked better.”
It was an attempt to repeatedly observe and record what was changing, where it was changing and how that changed over time.
Nitrogen Inputs Fell on All Three Farms
This may be the most commercially significant part of the programme.
The recorded nitrogen changes were approximately:
Leeston
270 → 190 kg N/ha
Around 30% lower
Bankside
280 → 190 kg N/ha
Around 32% lower
Oxford
340 → 200 kg N/ha
Around 41% lower
The programme's overall summary described the reduction as approximately 100 units of nitrogen per hectare across the farms.
The important point isn't simply that less nitrogen was applied.
It is what happened alongside that reduction.
Soil Assessments Moved in the Opposite Direction
All three farms were initially described as having issues including compaction, limited aeration and poor root development.
As the programme progressed, soil assessment scores generally increased rather than declined.
On Farm 1, the programme summary records the soil score increasing from approximately 12 to 24.
On Farm 2, approximately 14 to 24.
And on Farm 3, approximately 14 to 24.
These were field assessments rather than laboratory measurements.
But they were repeated assessments, taken across multiple paddocks and over multiple seasons.
What Did That Change Look Like in the Paddock?
Some of the individual paddock records make the wider trend easier to see.
Paddock 22
Paddock 22 was recorded on 29 August 2017, immediately before the farm was due to receive its first Turbo N application.
Its recorded VSA score at that point was:
6
By 15 May 2019, the comparison recorded:
22
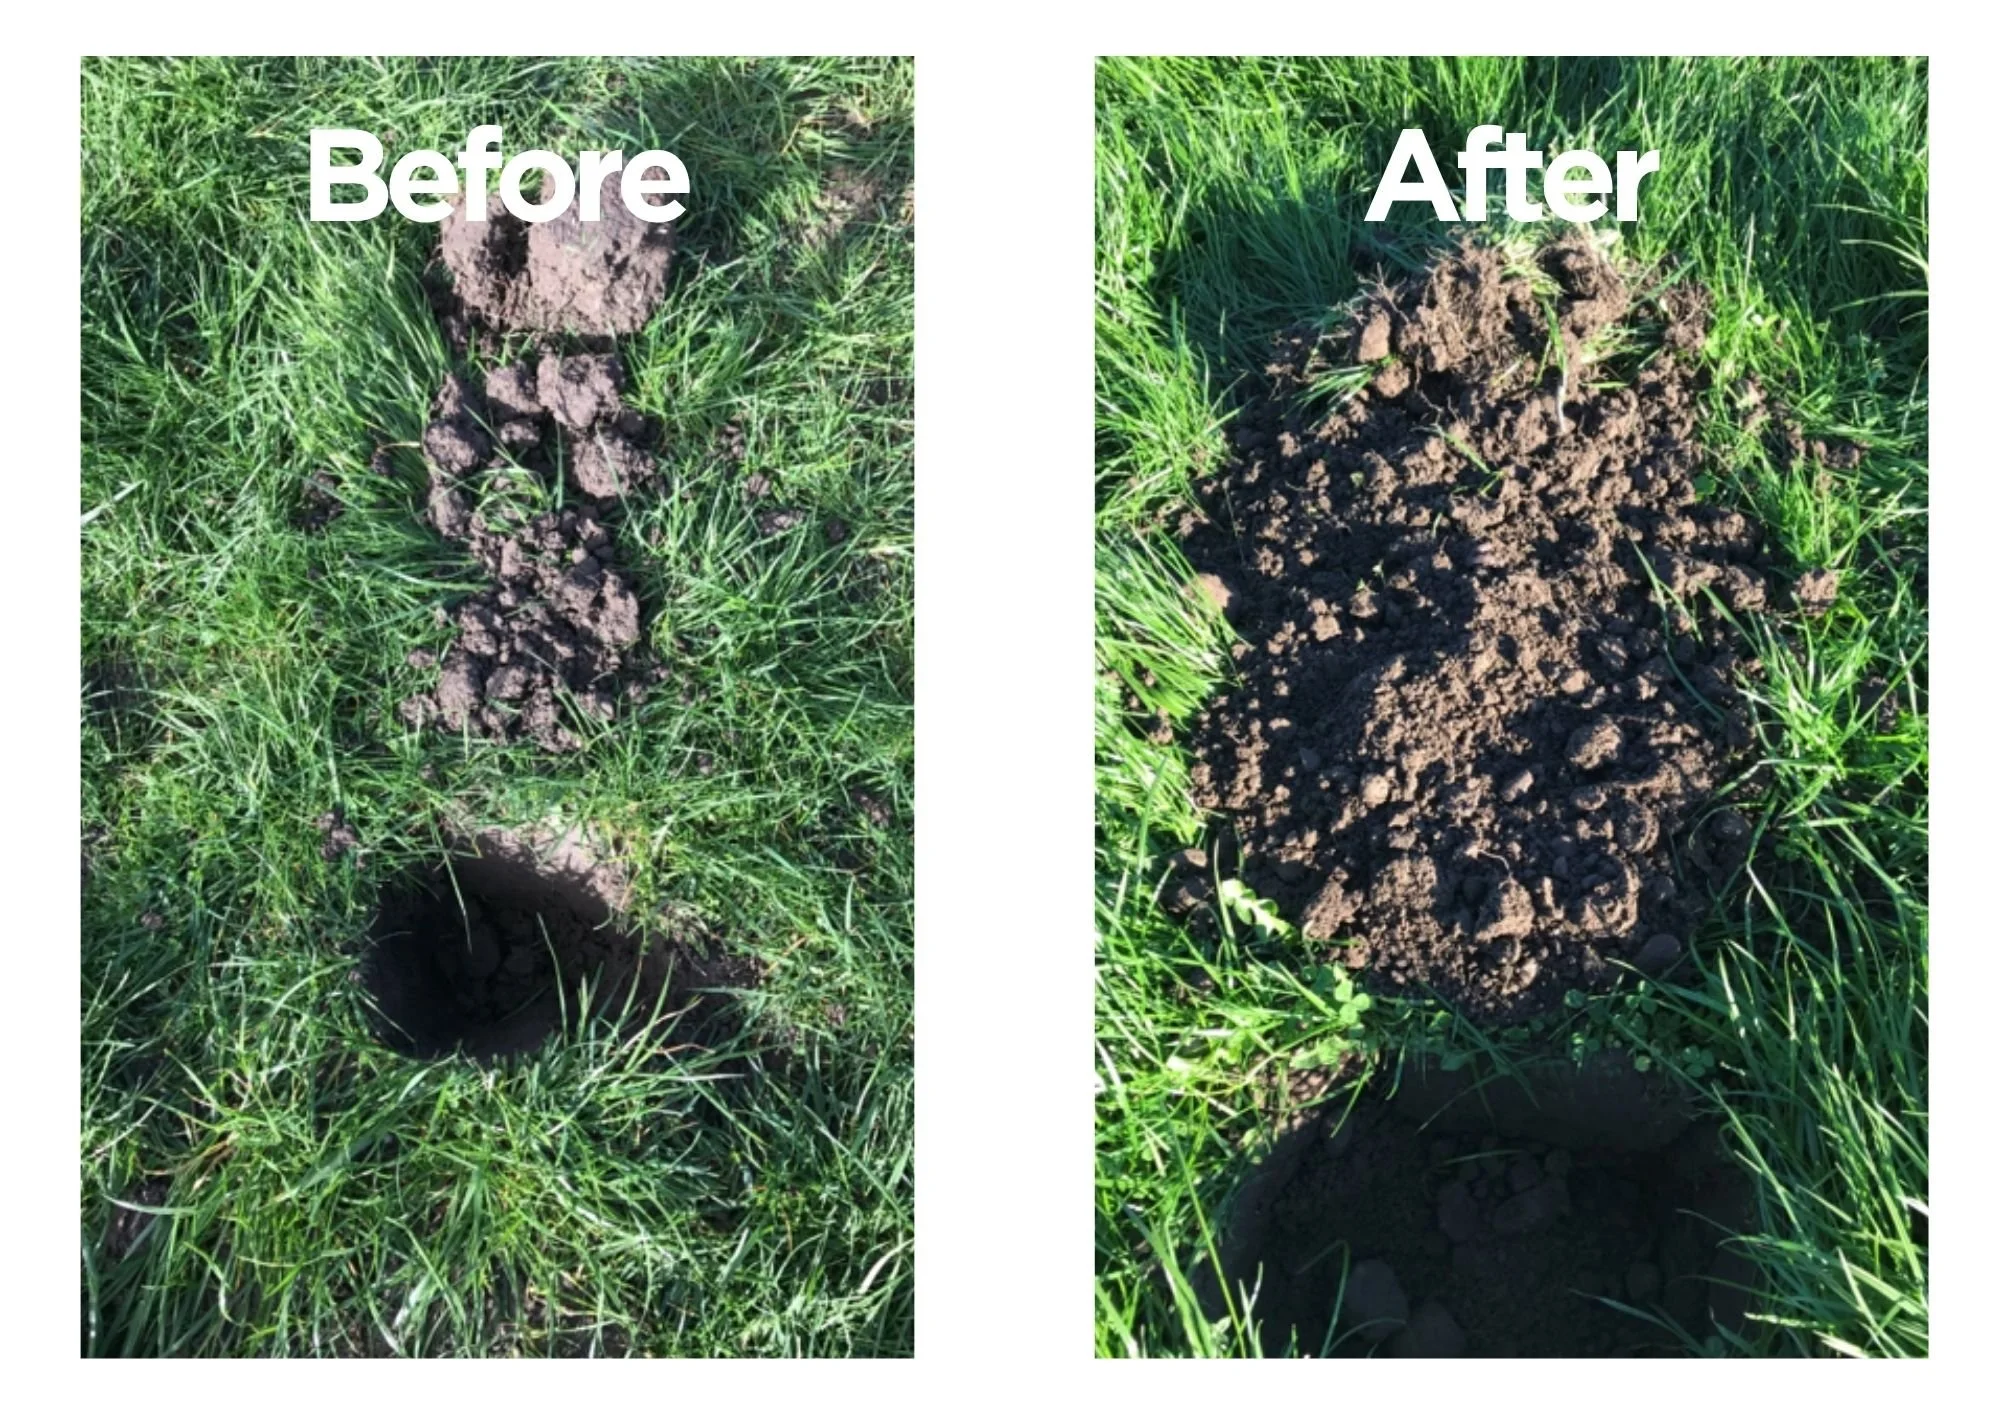
Paddock 22: visual soil assessment and photographed soil condition before treatment in August 2017 and again in May 2019.
The photographs show a visibly different soil structure.
Roots Changed Too
Root development was one of the clearest recurring changes recorded during the programme.
Across ten paddocks where root depth was measured, average root depth increased from approximately:
62 mm → 105 mm
between 2018 and 2019.
That is an increase of 43 mm, or approximately 69%.
Longer-term observations also recorded individual areas with roots reaching 200–250 mm or more.
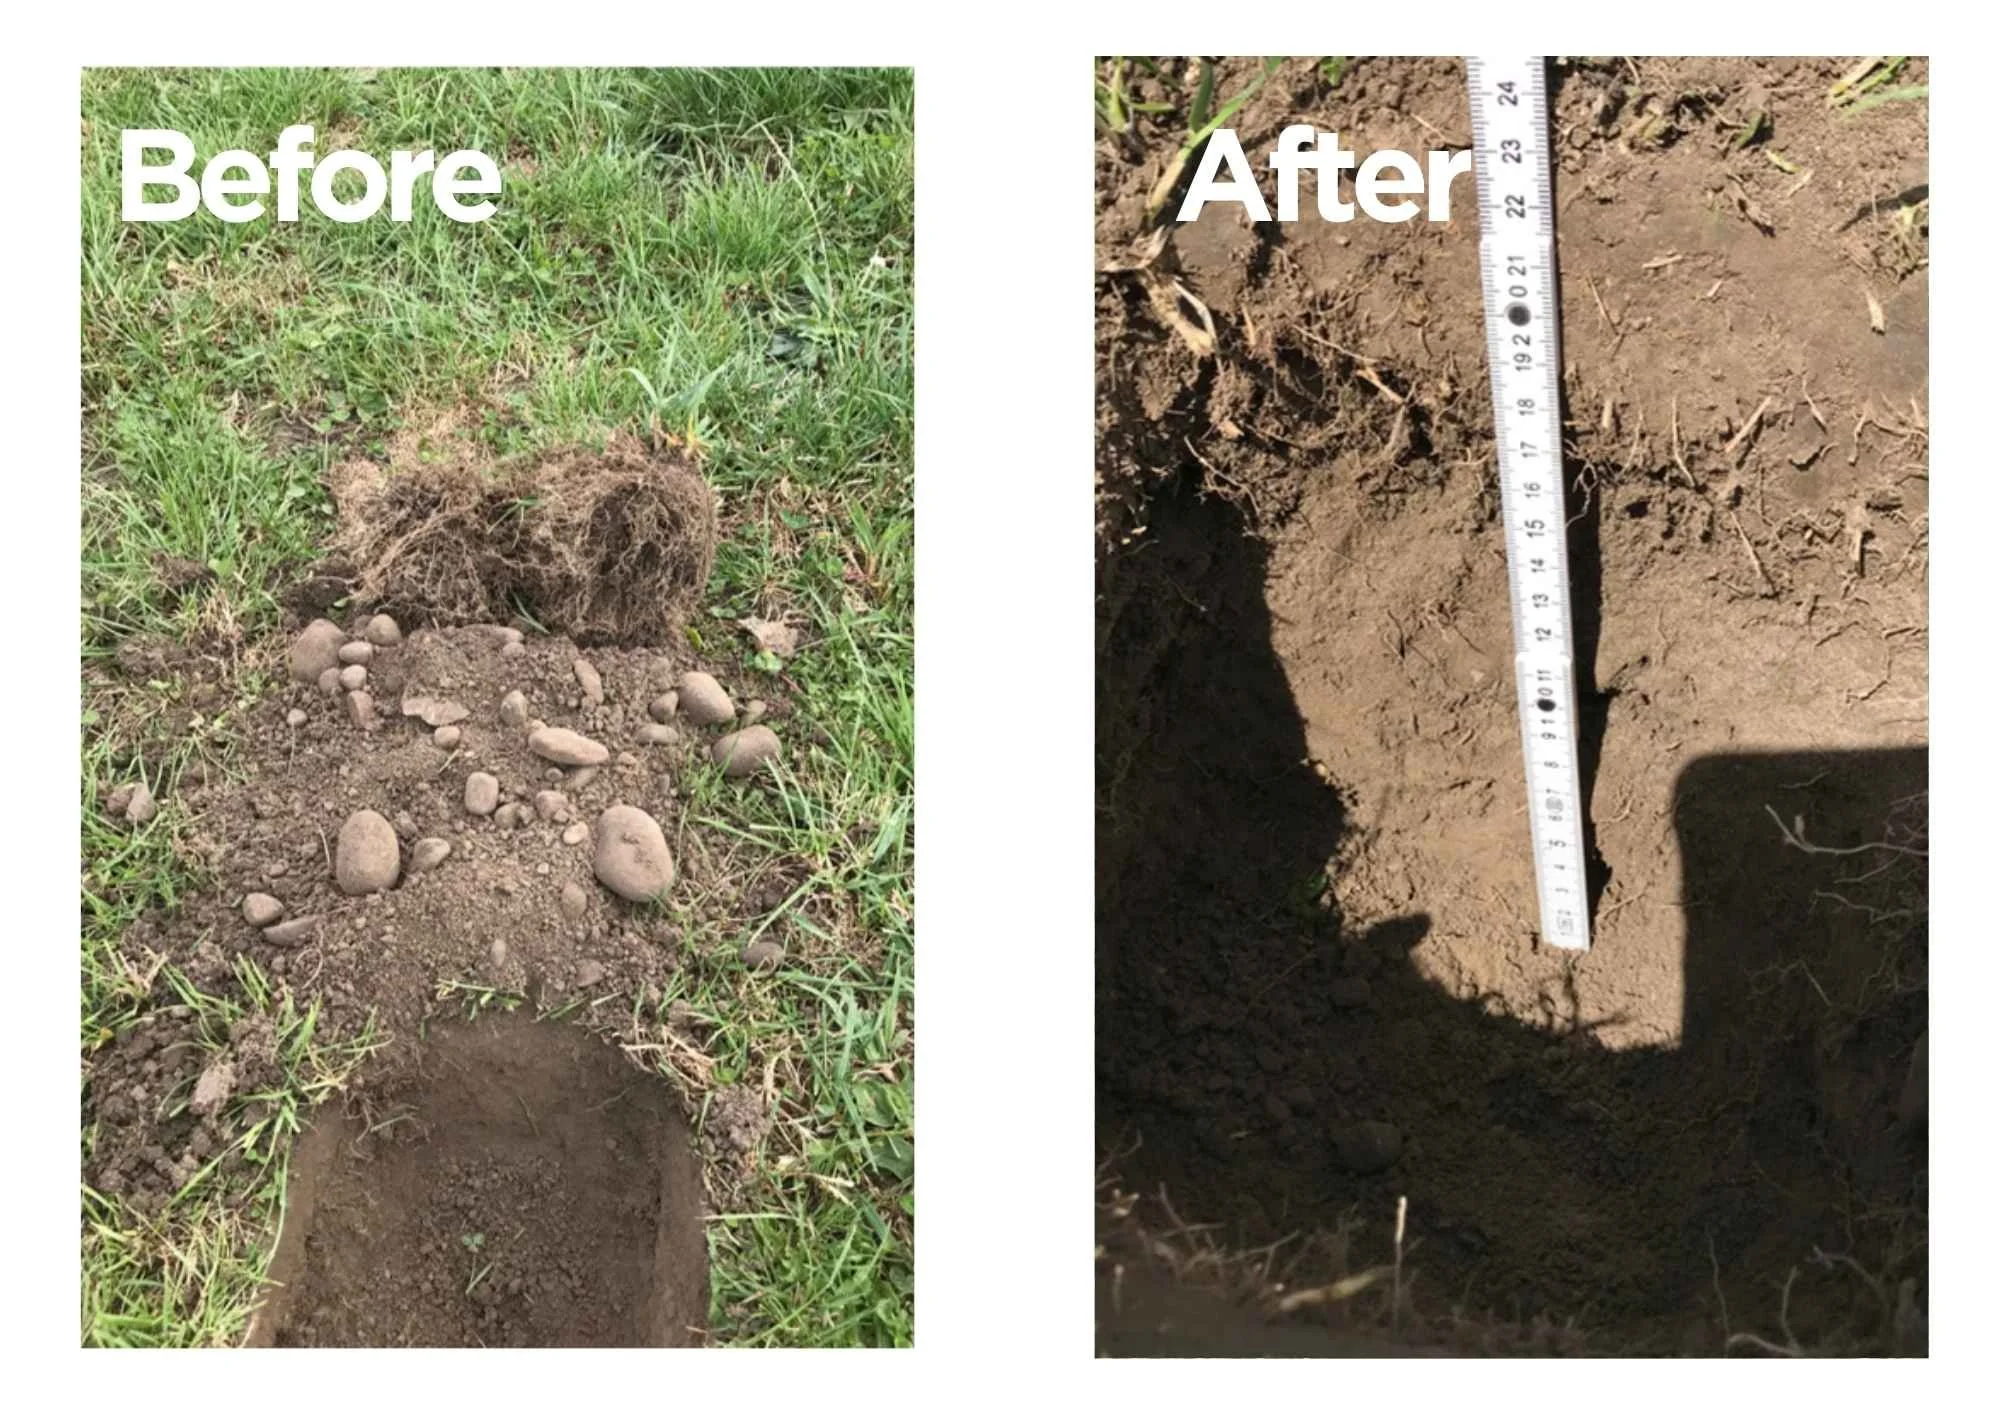
“roots working down 230mm+”
By 2020, roots in the Paddock 1–3 area were observed extending beyond 230 mm in parts of the profile.
Another Soil Indicator Changed
Paddock 10 provides a smaller but useful example.
The recorded earthworm count increased from:
3 worms per dig
in February 2018 to:
10 worms per dig
in February 2019.
During the same period, field notes described the soil becoming more open and roots increasingly growing downward rather than laterally.
One worm count doesn't prove a biological mechanism.
But it adds another observed change to the wider soil picture.
What About Pasture Performance?
The programme did not rely solely on soil observations.
Pasture utilisation was also estimated using farm back-calculations.
On one of the monitored farms, calculated milk solids produced from home-grown forage increased from:
2016–17
1,127 kg MS/ha
2017–18
1,184 kg MS/ha
2018–19
1,268 kg MS/ha
while calculated pasture utilisation moved from approximately:
69% → 71% → 75%
These are calculated farm-system outputs rather than direct measurements of pasture utilisation, so they should be treated accordingly.
But the direction is commercially important:
More productive value was being calculated from home-grown pasture as the programme progressed.
Four Connected Parts of the Farming System
The programme is a useful example of why DCT looks at farm performance through four connected areas:
Soil Function
Repeated visual assessments generally showed improvement in soil condition across the monitored farms.
Root Development
Root depth and density increased across many of the monitored areas.
Nutrient Efficiency
Nitrogen inputs fell substantially on all three farms.
Plant Performance
Pasture utilisation and home-grown forage contribution improved in the farm calculations where those data were available.
None of these needs to be treated as an isolated outcome.
The interesting part is that they were changing together.
What This Monitoring Does — and Doesn't — Show
This was a commercial farm monitoring programme, not a randomised controlled trial.
There were no untreated whole-farm controls.
Management, weather, grazing, irrigation and seasonal conditions continued to affect each farm.
The Visual Soil Assessment scores are structured field observations rather than laboratory measurements.
Pasture utilisation was estimated through back-calculation rather than directly measured.
And the programme does not allow us to say that DCT alone caused every change recorded.
That would be a bigger claim than the evidence supports.
What the programme does show is more useful:
Three different commercial dairy farms were followed over three seasons.
Nitrogen inputs reduced on all three.
Soil and root assessments generally improved rather than deteriorated.
And those changes were recorded repeatedly through the programme.
Why This Matters Commercially
Reducing nitrogen is easy if you're prepared to accept lower performance.
That isn't the opportunity.
The opportunity is:
Can the farming system continue to perform while requiring less input?
On these three Canterbury farms, nitrogen use moved down while the indicators being followed for soil and roots moved largely in the opposite direction.
That doesn't prove one caused the other.
But commercially, it is exactly the relationship worth investigating.
Because if a farm can make better use of the soil, roots and nutrients it already has, the question changes from:
“How much more do we need to apply?”
to:
“How much more can we get from what we're already putting in?”
Better Farming Starts With Better Understanding
The strength of this monitoring programme isn't one extraordinary number.
It's the pattern.
Three farms.
Different soils.
Multiple paddocks.
Three seasons.
And despite those differences:
Nitrogen use fell while soil and root assessments improved.
That is not the end of the question.
It's the reason to keep asking it.
Are You Getting the Return You Should From Your Nitrogen Programme?
If nitrogen inputs remain high but pasture response, rooting or soil performance isn't improving with them, talk to DCT about where greater efficiency may be possible within your existing programme.

Continue Exploring the other foundations:
-
Root Development
Understanding how plants explore the soil for water and nutrients.
-

Soil Function
Understanding the environment where roots, water, nutrients and living processes interact.
-
Nutrient Efficiency
Understanding how farming systems capture and use available nutrients.
-
Plant Performance
Understanding how plants convert available resources into productive growth.