Pasture Mineral Profile Changed Substantially Over One Year
Pasture Mineral & DCAD Case Study — New Zealand Dairy Farm
Pasture testing approximately one year apart recorded higher Magnesium, Zinc, Copper and Selenium — while DCAD moved from 511 to 249 me/kg.
Pasture isn't simply feed.
It is the pathway through which much of the mineral nutrition available within a farming system ultimately reaches the animal.
On this dairy farm, mixed-pasture testing approximately one year apart provides an interesting look at how that mineral profile changed during a DCT Turbo N programme.
The results weren't a case of every mineral simply increasing.
Instead, the balance of minerals within the pasture changed substantially.
Among the largest movements were:
Magnesium +37%
Zinc +31%
Copper +90%
Selenium +86%
At the same time:
DCAD: 511 → 249 me/kg
A reduction of approximately 51%.
The Result at a Glance
Magnesium
27 → 37 g
+37%
Zinc
335 → 438 mg
+31%
Copper
68 → 129 mg
+90%
Selenium
1.4 → 2.6 mg
+86%
DCAD
511 → 249 me/kg
−51%
Period
Approximately One Year
System
Dairy Pasture
DCT Programme
Turbo N
Evidence
Before-and-After Pasture Mineral Testing
The Starting Pasture
The first mixed-pasture test showed that mineral supply wasn't simply a question of whether minerals were present.
There were substantial differences across the mineral profile.
Among the initial results were:
Magnesium — 27 g
Zinc — 335 mg
Copper — 68 mg
Selenium — 1.4 mg
Potassium — 482 g
Sodium — 34 g
The report also calculated:
DCAD — 511 me/kg
The laboratory report itself identified a DCAD below 200 me/kg as its recommended level for the animal scenario being assessed.
So the starting result wasn't simply about individual minerals.
There was also a wider dietary mineral-balance question.
Approximately One Year Later
The pasture was tested again after approximately one year of the Turbo N programme.
The second sample was taken from the same paddock and approximately the same area.
This time the pasture test recorded:
Magnesium — 37 g
Zinc — 438 mg
Copper — 129 mg
Selenium — 2.6 mg
Potassium — 444 g
Sodium — 40 g
And DCAD had moved to:
249 me/kg
The changes in several of the minerals were substantial.
Four Minerals Stand Out
Magnesium
27 → 37 g
An increase of approximately:
37%
Magnesium is an important component of animal mineral nutrition, making its concentration in pasture particularly relevant in dairy systems.
Zinc
335 → 438 mg
An increase of approximately:
31%
Copper
68 → 129 mg
An increase of approximately:
90%
Copper almost doubled between the two pasture tests.
Selenium
1.4 → 2.6 mg
An increase of approximately:
86%
Again, this was not a calculated projection.
It was the difference recorded between the two pasture tests.
If Selenium Is Commonly a Challenge in New Zealand Pasture, What Does an 86% Increase Tell Us?
Selenium is a particularly interesting part of this case because low selenium availability is a recognised issue in New Zealand pastoral agriculture.
Over approximately one year, the amount represented in the pasture analysis increased from 1.4 to 2.6 mg/day — an increase of approximately 86% at the same assumed 14 kg daily pasture intake.
The test doesn't tell us why selenium uptake changed, and this result shouldn't be interpreted as a replacement for animal mineral testing or appropriate supplementation.
But it does demonstrate something important:
more selenium was present in the pasture available to the animal at the second test.
The Actual Test Evidence
The historical pasture-test results behind this case have been retained.
These aren't illustrative charts.
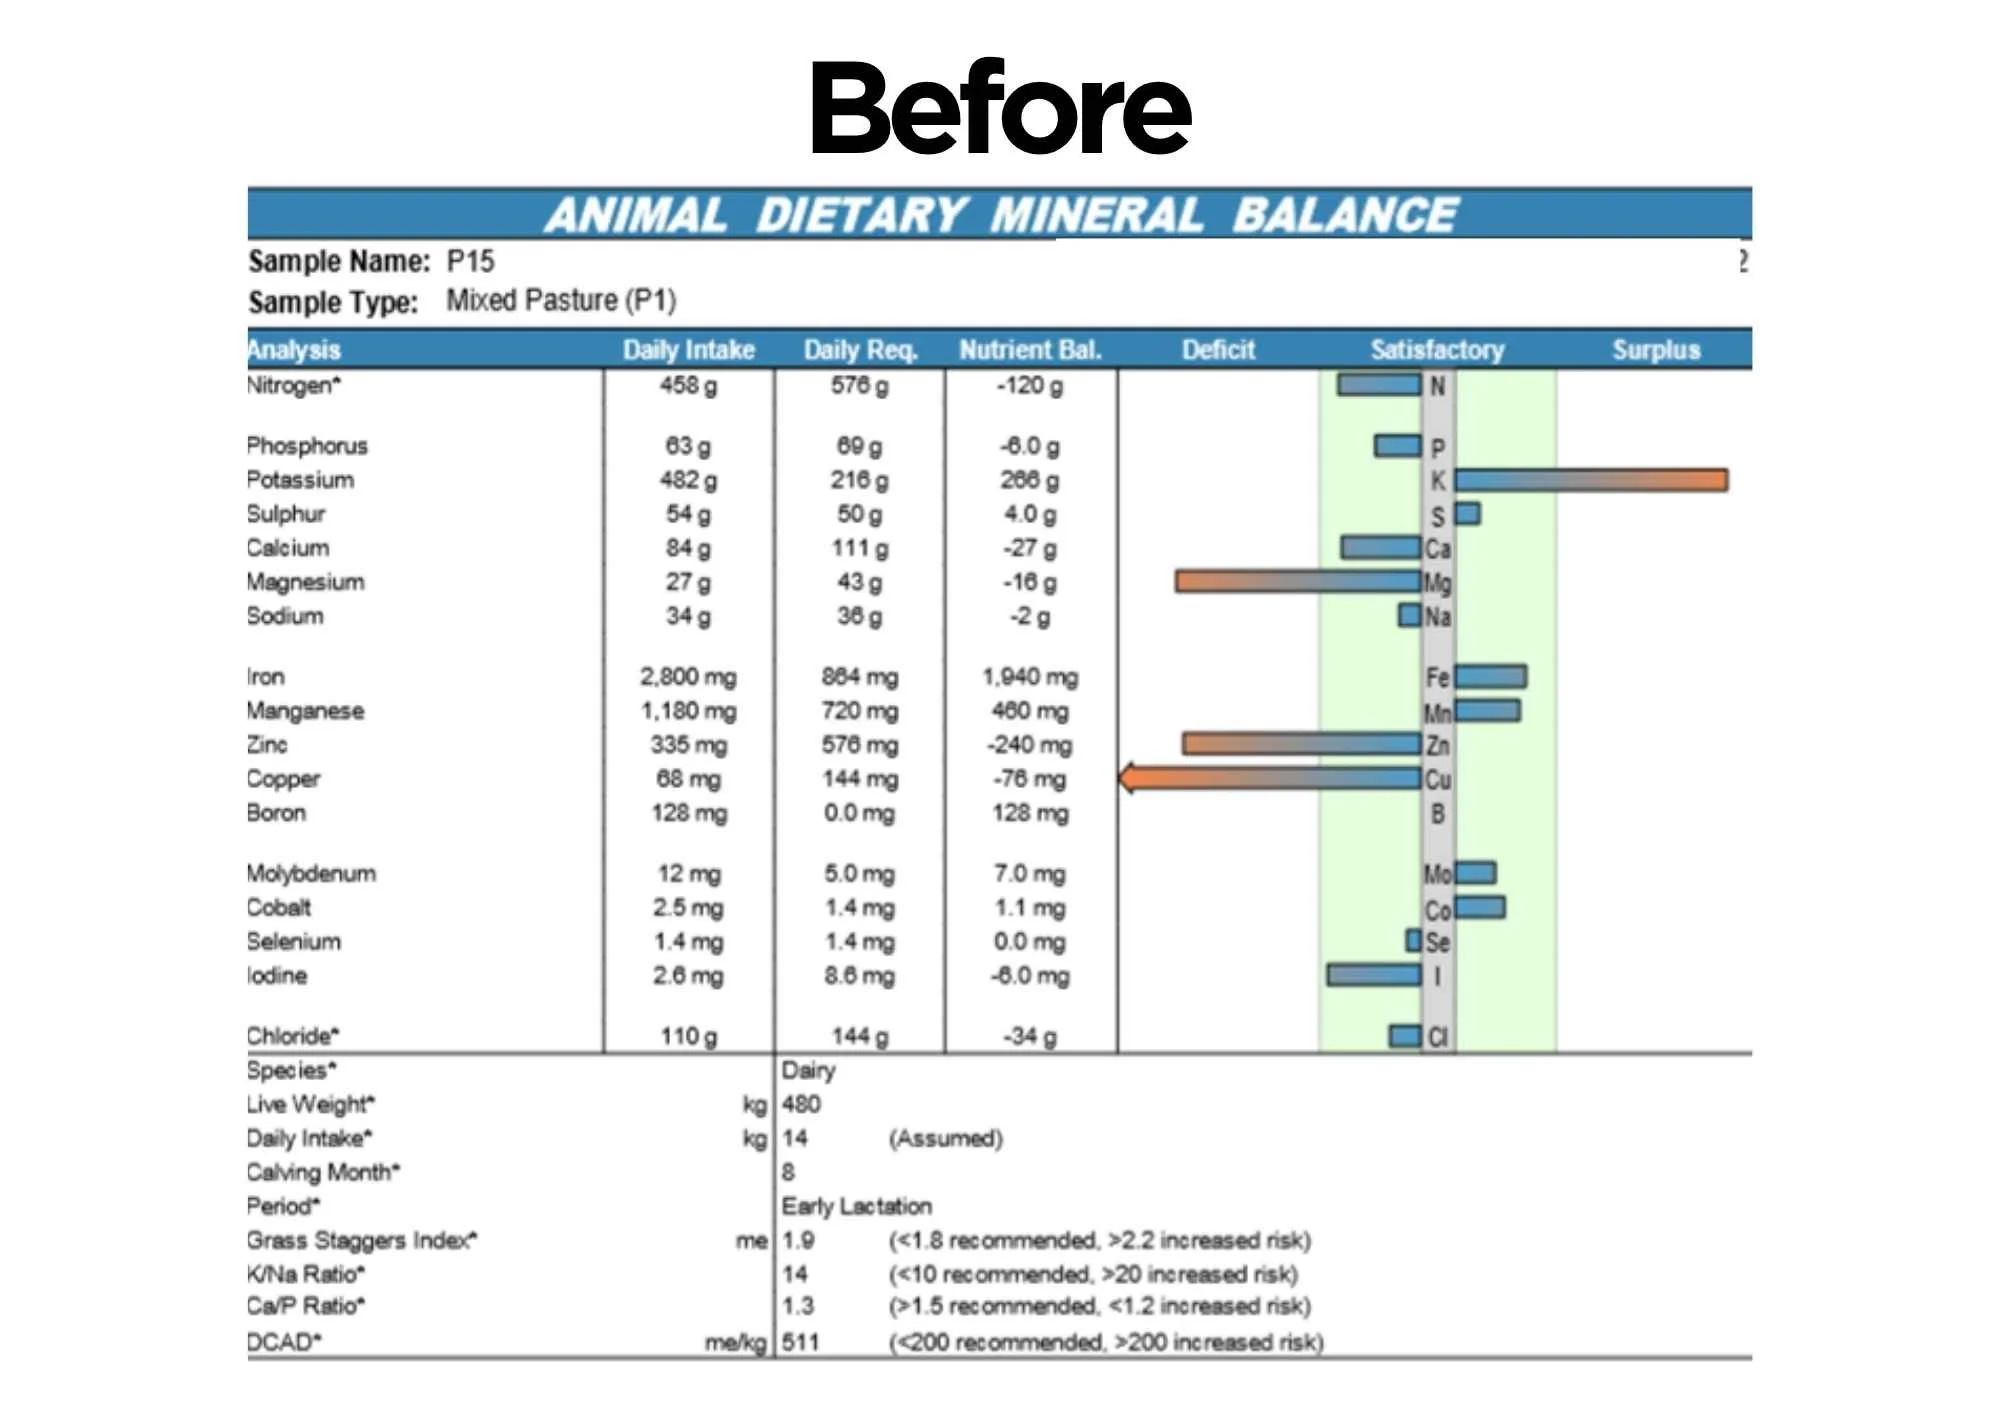
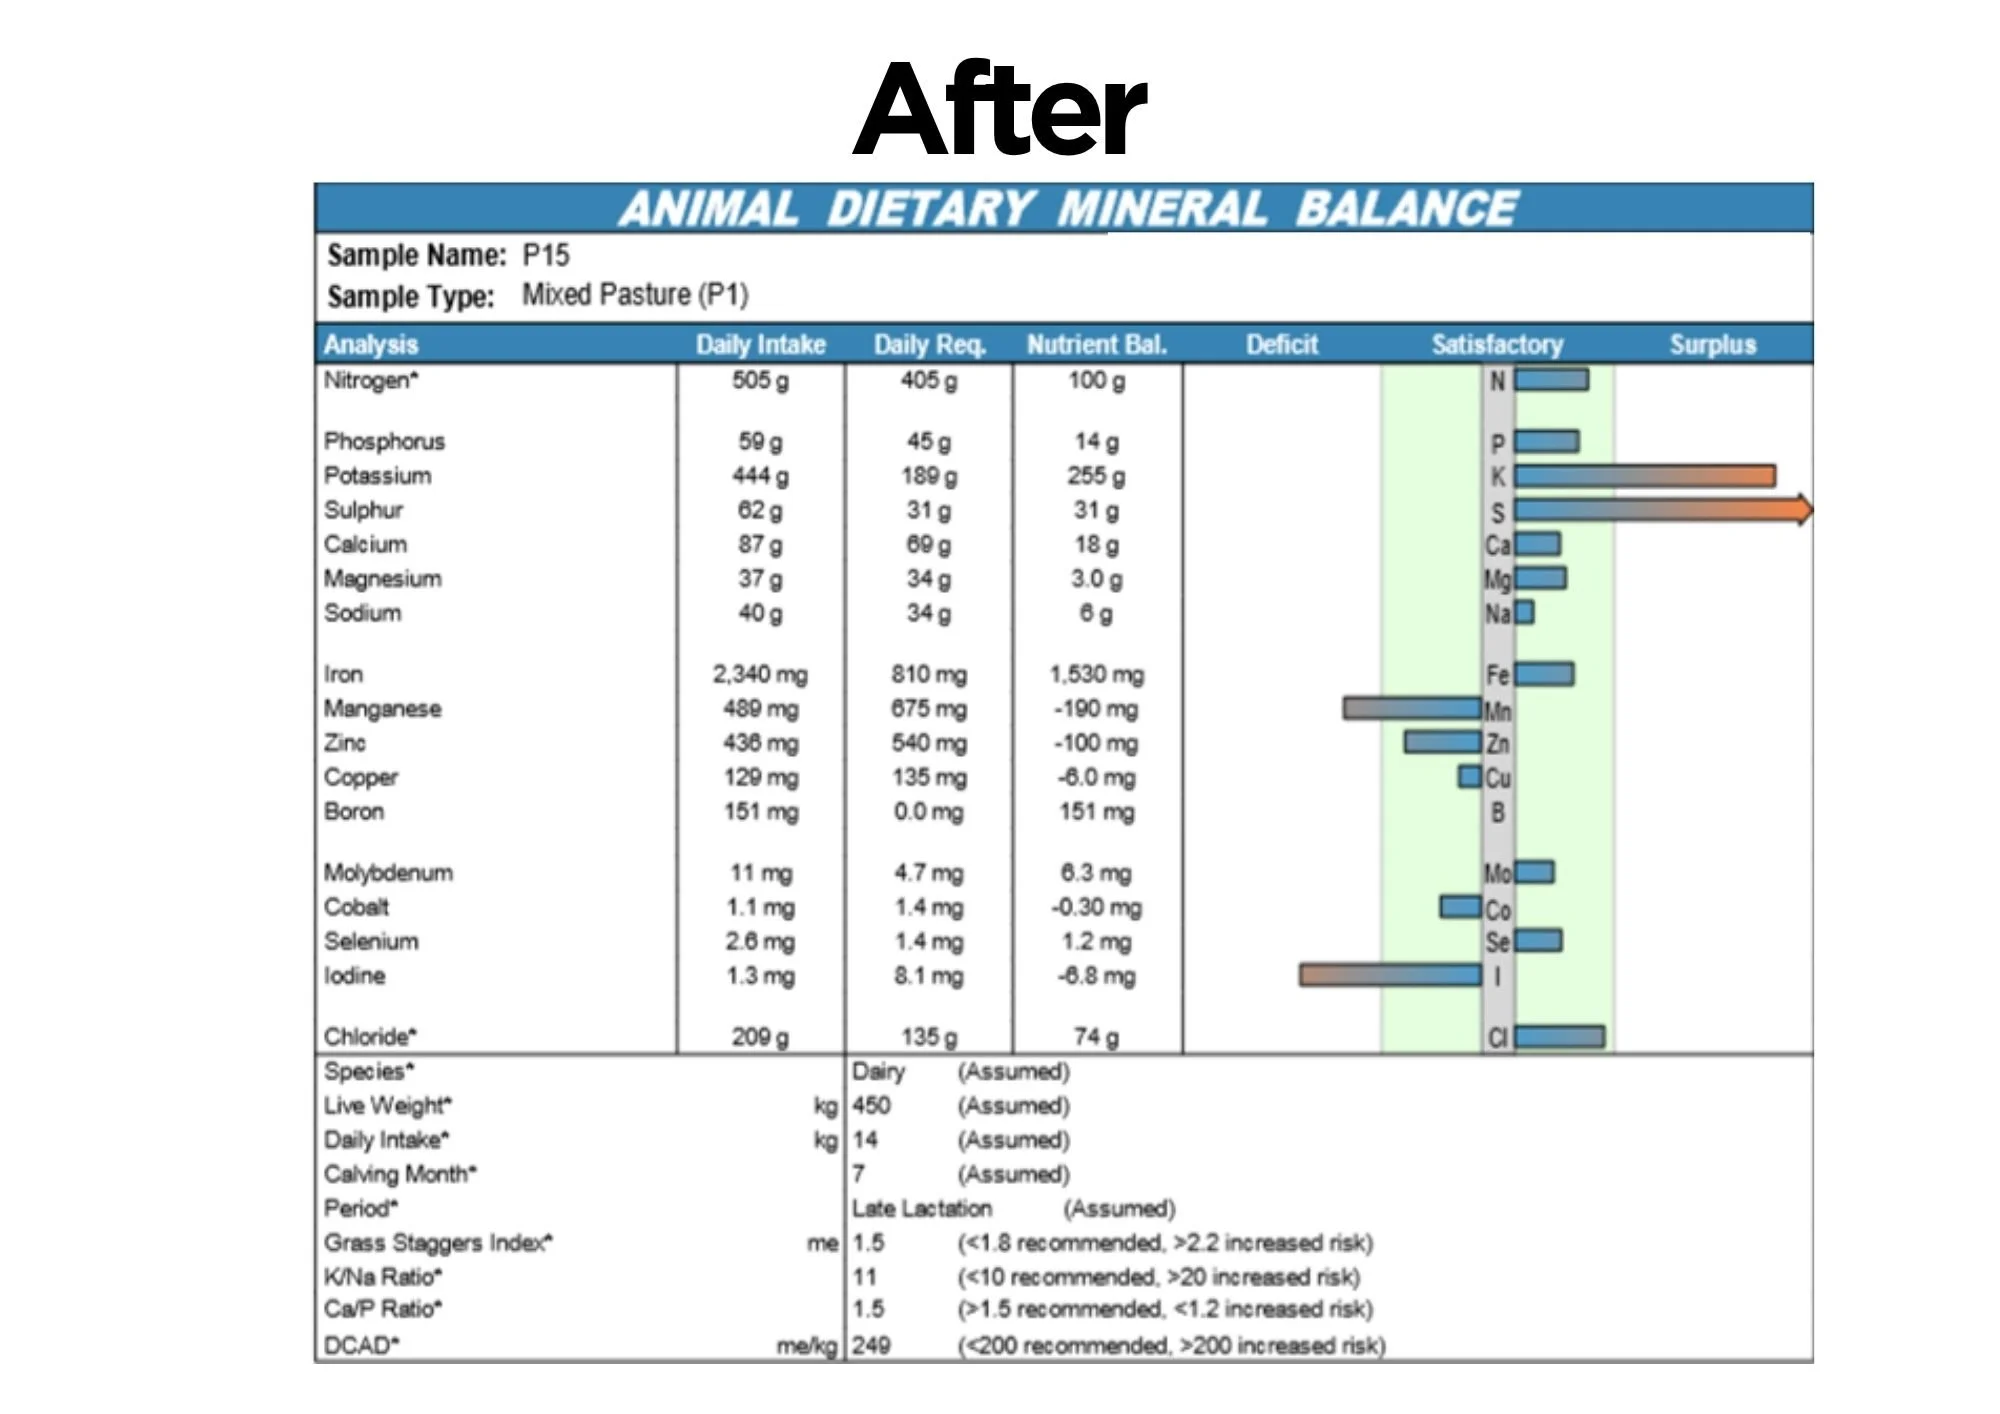
They are images of the actual historical pasture mineral-balance reports behind this case.
Before
Magnesium — 27 g
Zinc — 335 mg
Copper — 68 mg
Selenium — 1.4 mg
DCAD — 511 me/kg
One Year Later
Magnesium — 37 g
Zinc — 438 mg
Copper — 129 mg
Selenium — 2.6 mg
DCAD — 249 me/kg
It Wasn't Simply a Case of Everything Going Up
This is an important part of the result.
Some minerals increased.
Others decreased or remained relatively stable.
For example:
Calcium — 84 → 87 g
Potassium — 482 → 444 g
Iron — 2,800 → 2,340 mg
Manganese — 1,180 → 489 mg
Iodine — 2.6 → 1.3 mg
So we don't interpret this case as:
“DCT made every mineral increase.”
That's not what the testing shows.
What it shows is more interesting.
The pasture mineral profile changed.
And some of those changes moved important minerals substantially.
DCAD: 511 → 249
One of the largest changes occurred in Dietary Cation Anion Difference — DCAD.
The first report calculated:
511 me/kg
Approximately one year later:
249 me/kg
That's a reduction of approximately:
51%
The second result was still above the <200 me/kg recommendation printed on these reports.
So we don't describe 249 as an optimal result.
But moving from 511 to 249 represents a substantial shift in the calculated dietary cation-anion balance of the pasture.
What Else Changed in the Mineral Balance?
There are several interesting movements behind the headline DCAD number.
Potassium moved:
482 → 444 g
while sodium moved:
34 → 40 g
The report's K/Na ratio consequently moved:
14 → 11
with the report identifying below 10 as its recommended level.
The Ca/P ratio also moved:
1.3 → 1.5
with the report identifying above 1.5 as recommended.
These results suggest something broader than the improvement of one individual mineral.
The relationships between minerals in the pasture were changing as well.
Why Does Pasture Mineral Balance Matter?
A soil can contain a nutrient without that automatically meaning the plant will take it up in the amount required.
Nutrient availability is influenced by a complex interaction between:
soil chemistry
root development
water
pH
nutrient interactions
and:
the plant itself
That is why DCT looks beyond simply asking:
“How much nutrient was applied?”
A second question matters:
“How effectively is the soil–root–plant system using what is available?”
This case doesn't directly measure the mechanism behind the changing mineral profile.
But it does show that the mineral composition of the pasture was different approximately one year later.
What Could Explain the Change?
There isn't enough historical measurement to assign the result to one mechanism.
But there are several agronomically credible pathways worth considering.
Root Function
A larger or more effective root system can explore a greater volume of soil.
That potentially changes the plant's access to water and nutrients.
Root development itself wasn't measured in this case, so this remains a possible pathway rather than a measured result.
Nutrient Availability
Nutrients can behave very differently within soil depending on pH, moisture, chemistry and interactions with other elements.
Changes in the root-zone environment can therefore influence what the plant is able to access without necessarily requiring every nutrient input to increase.
Again, we don't have sufficient historical soil chemistry from this case to determine precisely what happened.
Plant Demand and Nutrient Balance
Plants don't take every mineral up independently.
Growth rate, season, pasture composition, nutrient interactions and environmental conditions can all affect tissue mineral concentration.
That makes the overall pattern more useful than focusing on one mineral in isolation.
And in this case, the overall pattern changed substantially.
An Important Point About the Two Reports
There is one difference between the reports that matters when interpreting them.
Both use an assumed pasture intake of:
14 kg/day
However, the animal scenarios used to calculate dietary requirements aren't identical.
The first report uses an assumed 480 kg dairy animal in early lactation.
The second uses an assumed 450 kg dairy animal in late lactation.
That changes some of the calculated daily requirements and therefore the report's displayed surplus or deficit figures.
For that reason, we don't use changes in those requirement columns as evidence that DCT improved animal nutrition.
Instead, this case focuses on the pasture mineral results themselves and the reported DCAD values.
It's an important distinction.
Understanding the Result Through the Four Pillars
DCT looks at agricultural performance through four connected areas:
Soil Function. Root Development. Nutrient Efficiency. Plant Performance.
This case is particularly relevant to Nutrient Efficiency and Plant Performance.
Nutrient Efficiency
The pasture mineral profile changed substantially over approximately one year.
Most notably:
Magnesium +37%
Zinc +31%
Copper +90%
Selenium +86%
This doesn't tell us precisely why availability or uptake changed.
It tells us that different quantities of those minerals were present in the pasture at the second test.
Plant Performance
Pasture is where changes in nutrient uptake become measurable within the plant.
That makes these before-and-after pasture tests direct evidence of a changing forage mineral profile.
Root Development
Root function provides an important pathway through which plants access water and nutrients.
However, roots weren't measured in this particular case.
We therefore treat root development as a possible contributor rather than a demonstrated result.
Soil Function
Soil chemistry and physical condition influence nutrient availability.
But without corresponding before-and-after soil testing, we don't claim that a particular soil mechanism produced these pasture changes.
What This Case Shows
Over approximately one year on a dairy pasture using Turbo N:
Magnesium increased 37%
Zinc increased 31%
Copper increased 90%
Selenium increased 86%
and:
DCAD moved from 511 to 249 me/kg
The second pasture sample is believed to have been collected from the same paddock and approximately the same area as the first.
The historical test reports behind the figures have been retained.
That gives us a useful before-and-after field observation.
The Bigger Question
The traditional response to a mineral problem can be to ask:
“What do we need to add?”
Sometimes that is exactly the right question.
But it isn't the only one.
There is another:
“What is already in the farming system — and how effectively is it getting into the plant?”
That's what makes this case interesting.
The DCT programme wasn't followed by a universal increase in every mineral.
Instead, the pasture's mineral profile and balance changed.
Some of those movements were substantial.
And they were measurable.
Better Farming Starts With Better Understanding
Approximately one year separated these two pasture tests.
During that period:
Magnesium:
27 → 37 g
Zinc:
335 → 438 mg
Copper:
68 → 129 mg
Selenium:
1.4 → 2.6 mg
and:
DCAD:
511 → 249 me/kg
Those results don't tell us every step in the pathway from soil to root to plant.
But they do tell us something important:
The pasture the animals were eating had changed.
And when we're trying to improve the efficiency of the whole farming system, understanding changes like these is a good place to start.
Want to Understand What's Happening in Your Pasture?
DCT works with farmers to look beyond inputs alone and understand how soil, roots, nutrients and plants are functioning together.

Continue Exploring the other foundations:
-
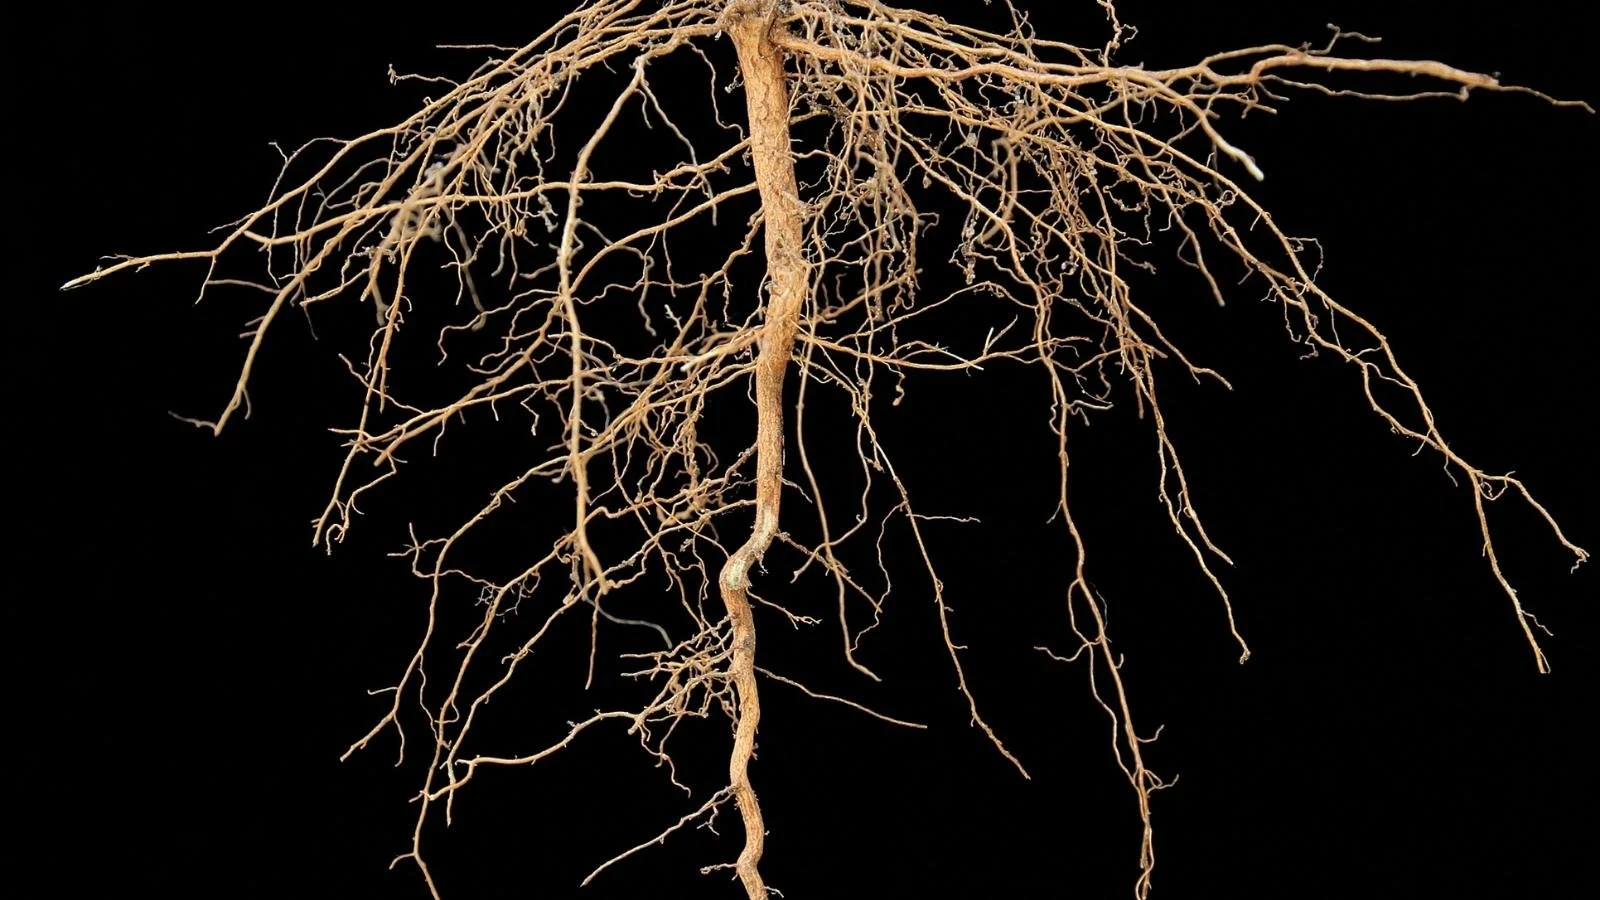
Root Development
Understanding how plants explore the soil for water and nutrients.
-
Soil Function
Understanding the environment where roots, water, nutrients and living processes interact.
-
Nutrient Efficiency
Understanding how farming systems capture and use available nutrients.
-
Plant Performance
Understanding how plants convert available resources into productive growth.