More Production From Home-Grown Pasture Over Three Years
Dairy Pasture Utilisation Case Study — New Zealand
Farm adviser calculations over three consecutive years showed milk attributed to home-grown forage increasing from 1,127 to 1,268 kg MS/ha, while calculated pasture utilisation moved from 69% to 75%.
Growing more grass is one way to improve farm performance.
But there is another opportunity:
Getting more productive value from the grass you're already growing.
On this dairy farm, three years of farm performance calculations prepared by an adviser provide an interesting picture of that happening.
Milk From Home-Grown Forage
1,127 → 1,184 → 1,268 kg MS/ha
Calculated Grass Utilised
10,999 → 11,322 → 12,033 kg DM/ha
Calculated Pasture Utilisation
69% → 71% → 75%
And by Year 3, total milk production had increased from:
1,748 → 1,896 kg MS/ha
One year's calculation can be interesting.
A three-year progression tells us considerably more.
Three Years of Farm Performance
Year 1
Milk Solids
460 kg MS/cow
1,748 kg MS/ha
Milk From Home-Grown Forage
1,127 kg MS/ha
297 kg MS/cow
Calculated Grass Utilised
10,999 kg DM/ha
Calculated Utilisation
69%
Purchased Feed
1,096 kg/cow
Stocking Rate
3.8 cows/ha
Year 2
Milk Solids
460 kg MS/cow
1,748 kg MS/ha
Milk From Home-Grown Forage
1,184 kg MS/ha
312 kg MS/cow
Calculated Grass Utilised
11,322 kg DM/ha
Calculated Utilisation
71%
Purchased Feed
996 kg/cow
Stocking Rate
3.8 cows/ha
Year 3
Milk Solids
475 kg MS/cow
1,896 kg MS/ha
Milk From Home-Grown Forage
1,268 kg MS/ha
318 kg MS/cow
Calculated Grass Utilised
12,033 kg DM/ha
Calculated Utilisation
75%
Purchased Feed
1,056 kg/cow
Stocking Rate
4.0 cows/ha
The Progression
Looking across all three years makes the result clearer.
Milk From Home-Grown Forage
Year 1 — 1,127 kg MS/ha
Year 2 — 1,184 kg MS/ha
Year 3 — 1,268 kg MS/ha
From Year 1 to Year 3:
+141 kg MS/ha
or approximately:
+12.5%
attributed to home-grown forage.
More From Home-Grown Feed Per Cow
The same progression appears on a per-cow basis.
Year 1 — 297 kg MS/cow
Year 2 — 312 kg MS/cow
Year 3 — 318 kg MS/cow
From Year 1 to Year 3:
+7.1%
This is important because the improvement wasn't simply the result of carrying more cows.
The calculation attributed more milk production per cow to home-grown forage as well.
More of the Available Pasture Was Being Utilised
Calculated grass utilised progressed:
Year 1 — 10,999 kg DM/ha
Year 2 — 11,322 kg DM/ha
Year 3 — 12,033 kg DM/ha
From Year 1 to Year 3:
+1,034 kg DM/ha
or approximately:
+9.4%
Calculated pasture utilisation consequently moved:
69% → 71% → 75%
That's an increase of:
6 Percentage Points
over the three-year period.
And By Year 3, Total Production Was Higher
Years 1 and 2 both recorded:
1,748 kg MS/ha
By Year 3:
1,896 kg MS/ha
That's an increase of approximately:
8.5%
Milk solids per cow had also increased:
460 → 475 kg MS/cow
while stocking rate had moved:
3.8 → 4.0 cows/ha
So by Year 3, the system was supporting more cows, greater production per cow and greater milk-solids production per hectare than in Year 1.
What Happened to Purchased Feed?
This is an important part of understanding the result.
Purchased feed per cow was:
Year 1 — 1,096 kg
Year 2 — 996 kg
Year 3 — 1,056 kg
So purchased feed didn't simply fall every year.
We don't claim that it did.
What is interesting is that by Year 3 — with stocking rate and milk production both higher — purchased feed per cow remained slightly below the Year 1 figure.
Meanwhile, milk attributed to home-grown forage had increased:
1,127 → 1,268 kg MS/ha
That's why we think the better description of this case is:
Making More of Home-Grown Feed
rather than simply:
Using Less Supplement
The Original Farm Calculations
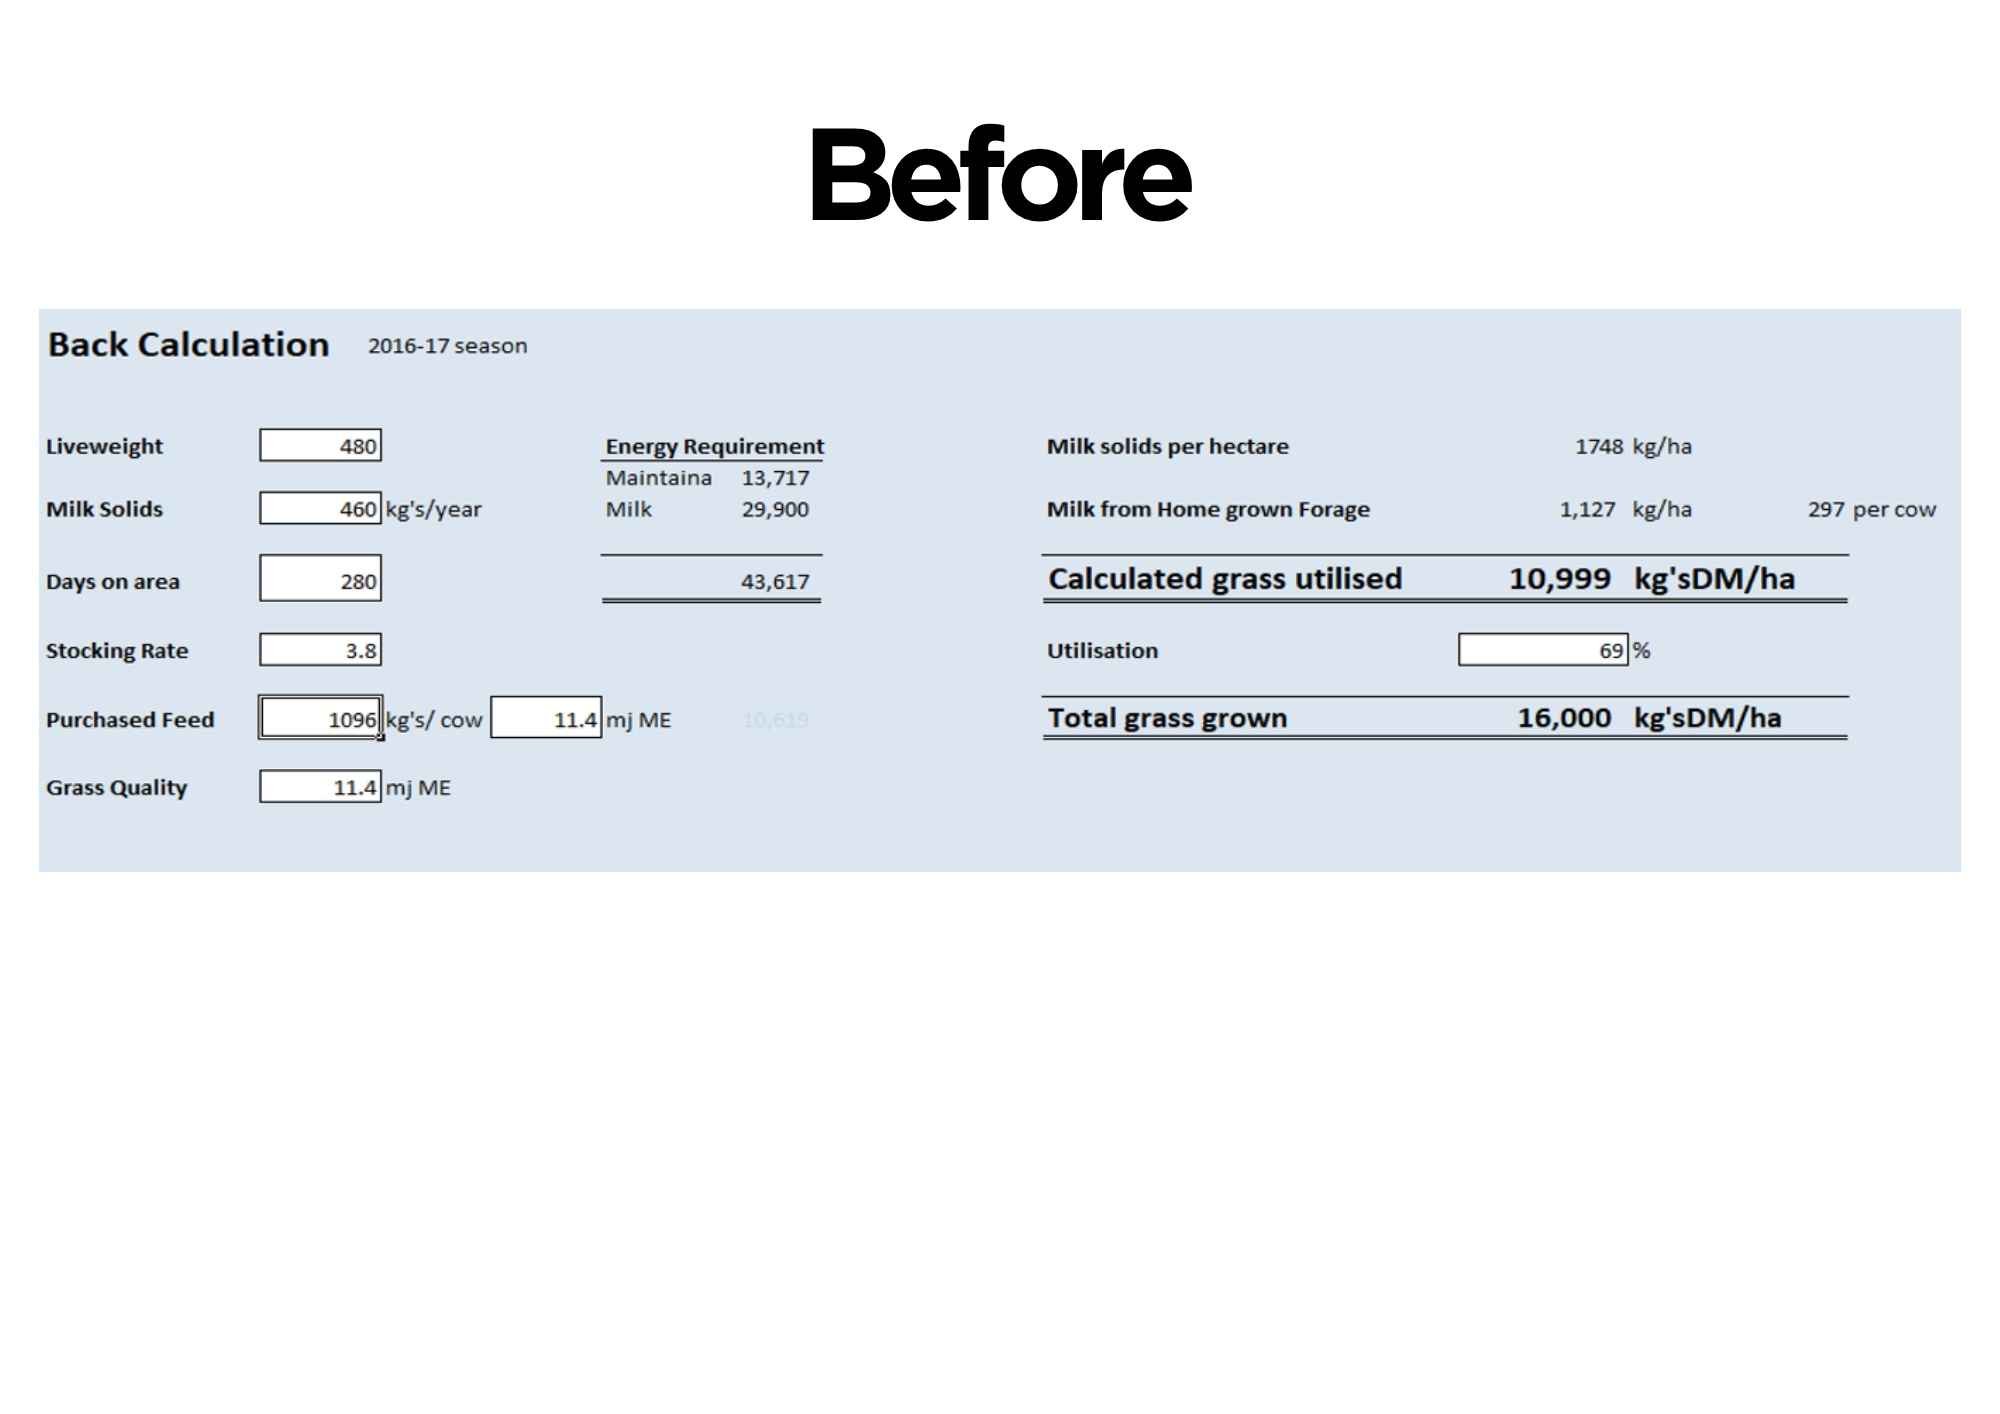
The historical adviser calculations behind this case have been retained.
Year 1
Milk from home-grown forage — 1,127 kg MS/ha
Calculated grass utilised — 10,999 kg DM/ha
Calculated utilisation — 69%
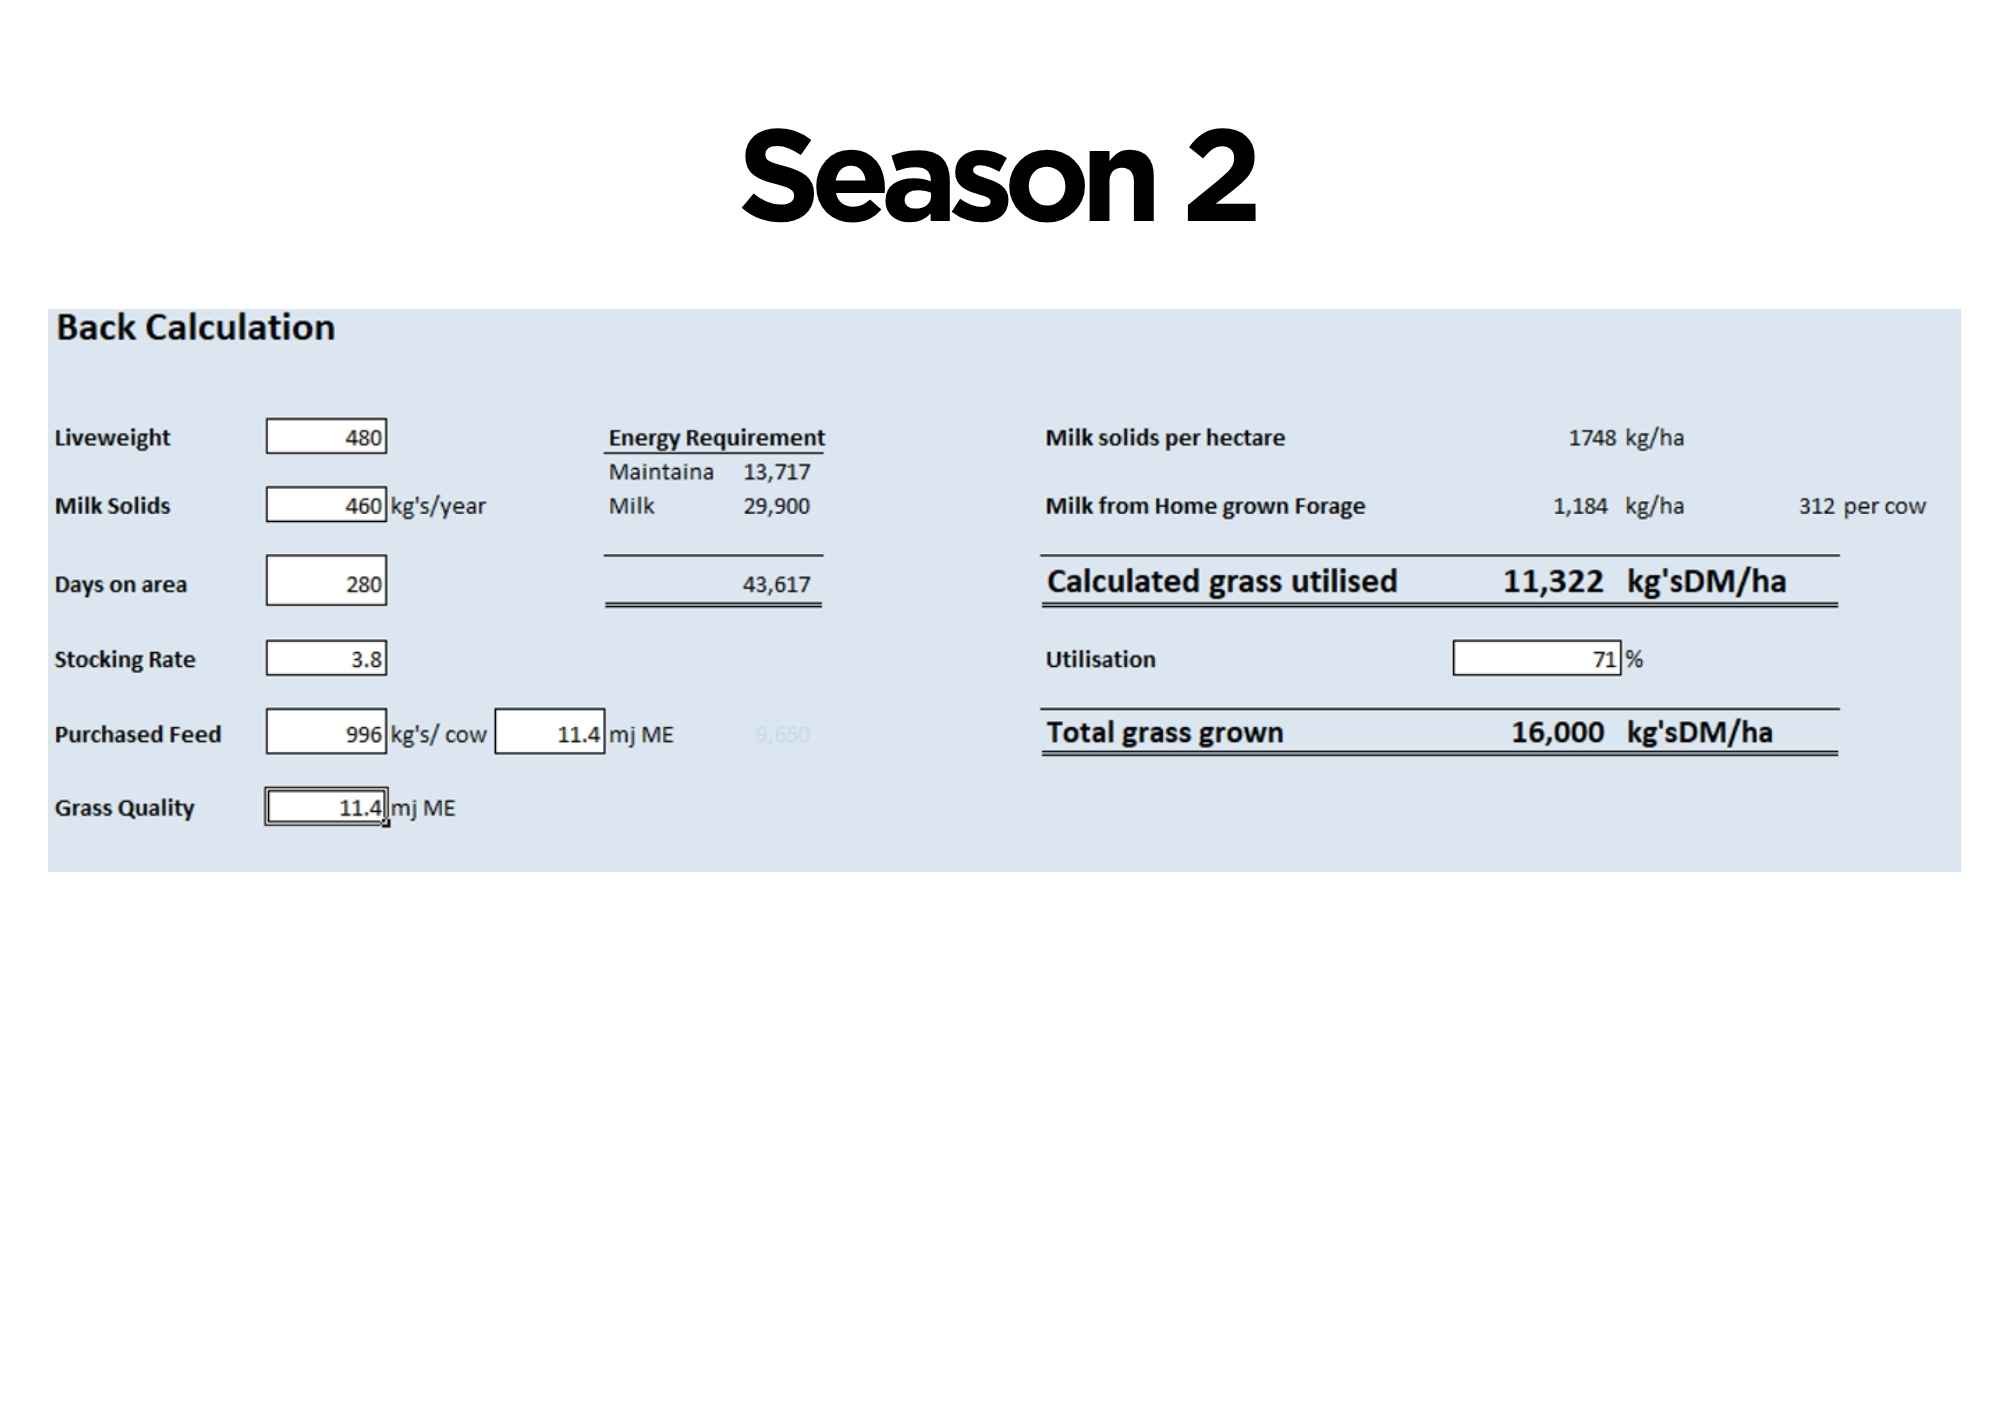
Year 2
Milk from home-grown forage — 1,184 kg MS/ha
Calculated grass utilised — 11,322 kg DM/ha
Calculated utilisation — 71%
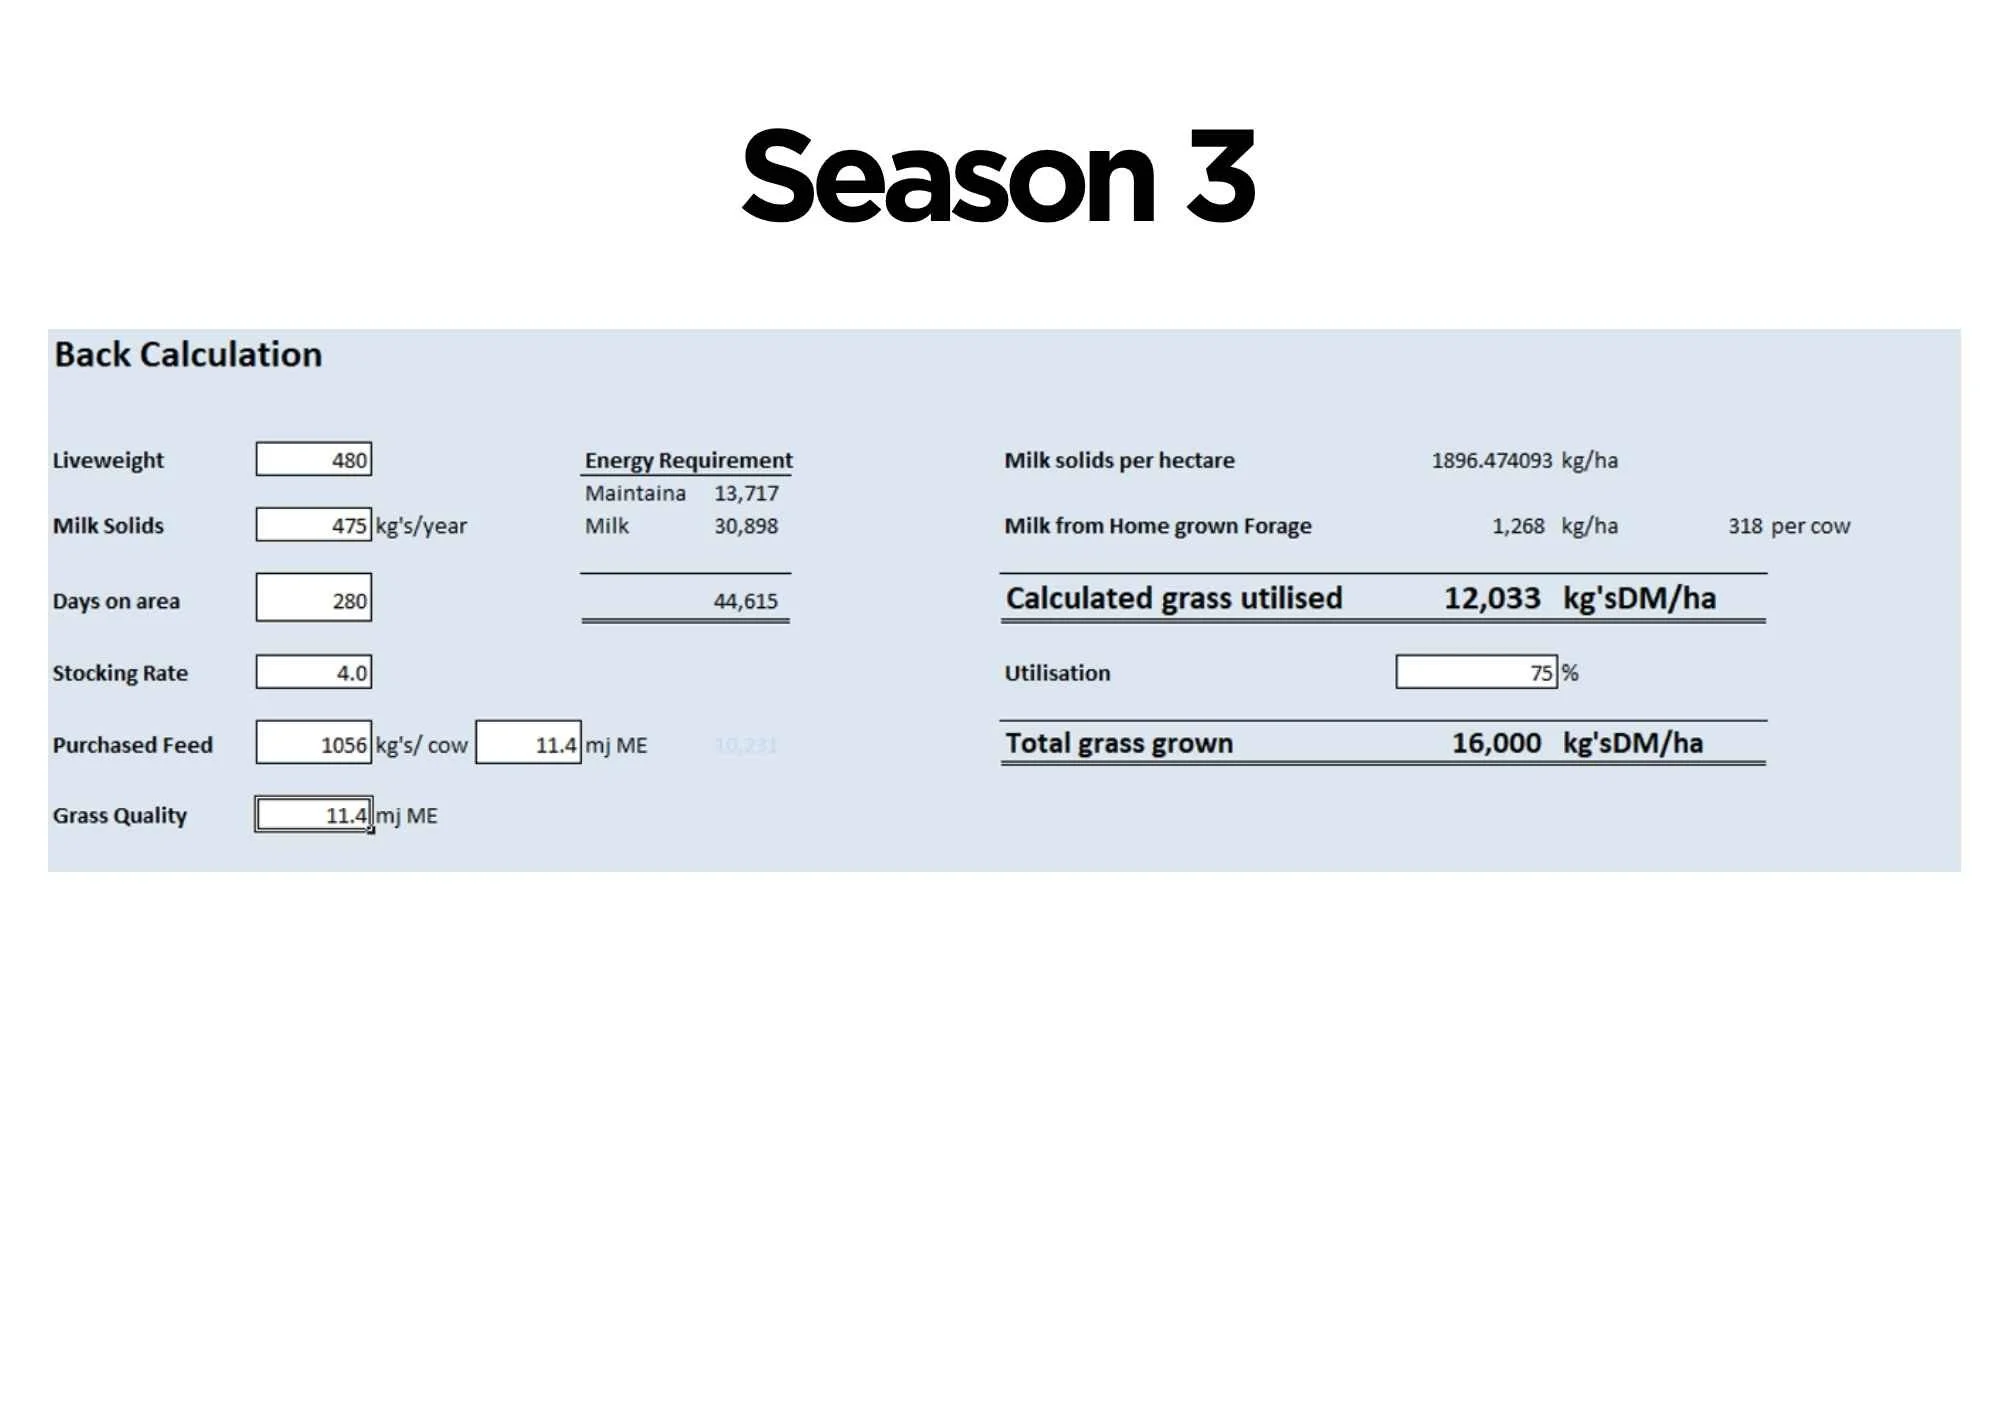
Year 3
Milk from home-grown forage — 1,268 kg MS/ha
Calculated grass utilised — 12,033 kg DM/ha
Calculated utilisation — 75%
These aren't illustrative figures.
They come from the historical farm performance calculations prepared by the farm's adviser/consultant.
An Important Distinction: Calculated, Not Directly Measured
These aren't laboratory measurements of pasture utilisation.
They are farm performance calculations based on farm data and the assumptions entered into the adviser's model.
For example, the calculations use:
Total grass grown — 16,000 kg DM/ha
and:
Grass quality — 11.4 MJ ME
across all three years.
We therefore describe:
69% → 71% → 75%
as calculated pasture utilisation.
That distinction matters.
But so does the consistency of the result.
Using the same grass-growth and grass-quality assumptions, the calculated amount of home-grown pasture contributing to production progressively increased across all three years.
Why Does Pasture Utilisation Matter?
Farmers already invest heavily in producing pasture.
The land is already there.
The fertiliser has been applied.
The pasture has been grown.
The animals are already grazing it.
The labour, machinery, management and money have already gone into the system.
The commercial question is:
How much productive value are you getting back from it?
Growing another tonne of dry matter can create value.
But so can getting more productive use from the pasture already being grown.
This case points toward the second opportunity.
Where DCT Fits
DCT was being used within the farm system during this period.
Our approach isn't simply about trying to push more grass out of every hectare.
It's about improving the conditions that allow the whole system to perform effectively.
We look at four connected areas:
Soil Function
The physical and chemical environment supporting pasture growth.
Root Development
The plant's ability to explore the soil for water and nutrients.
Nutrient Efficiency
How effectively available and applied nutrients are converted into useful growth.
Plant Performance
How effectively that pasture ultimately contributes to productive farm output.
A working farm is influenced by many factors, so these calculations don't isolate DCT as the sole cause of the three-year progression.
What they do show is what happened during the programme.
And the direction of travel is clear.
Year 1 → Year 2 → Year 3
Sometimes the most useful evidence isn't one dramatic result.
It's a progression.
Milk From Home-Grown Forage
1,127 → 1,184 → 1,268 kg MS/ha
Per Cow From Home-Grown Forage
297 → 312 → 318 kg MS/cow
Calculated Grass Utilised
10,999 → 11,322 → 12,033 kg DM/ha
Calculated Pasture Utilisation
69% → 71% → 75%
And by Year 3:
Total Milk Solids
1,896 kg MS/ha
compared with:
1,748 kg MS/ha
in Year 1.
More Than a Pasture Percentage
The old way of looking at this case would be to focus on the utilisation percentage.
But that misses the bigger commercial story.
From Year 1 to Year 3, the calculation attributed an additional:
141 kg MS/ha
to home-grown forage.
That's the result that matters.
Because pasture utilisation isn't valuable simply because the percentage gets bigger.
It's valuable when the farming system turns more of its home-grown resource into productive output and financial return.
Better Farming Starts With Better Understanding
Over three years, the farm adviser's calculations recorded a consistent progression:
69% → 71% → 75%
calculated pasture utilisation.
But underneath that percentage was something more important:
1,127 → 1,184 → 1,268 kg MS/ha
attributed to home-grown forage.
By Year 3, total production had also reached:
1,896 kg MS/ha
The farm was getting more productive value from its home-grown feed resource.
And that's ultimately the opportunity.
Not simply more input.
More return from the farming system you've already built.
Could Your Home-Grown Pasture Be Doing More?
DCT works with farmers to understand where soil, roots, nutrients or plant performance may be limiting the value they get from their existing farming system.

Continue Exploring the other foundations:
-
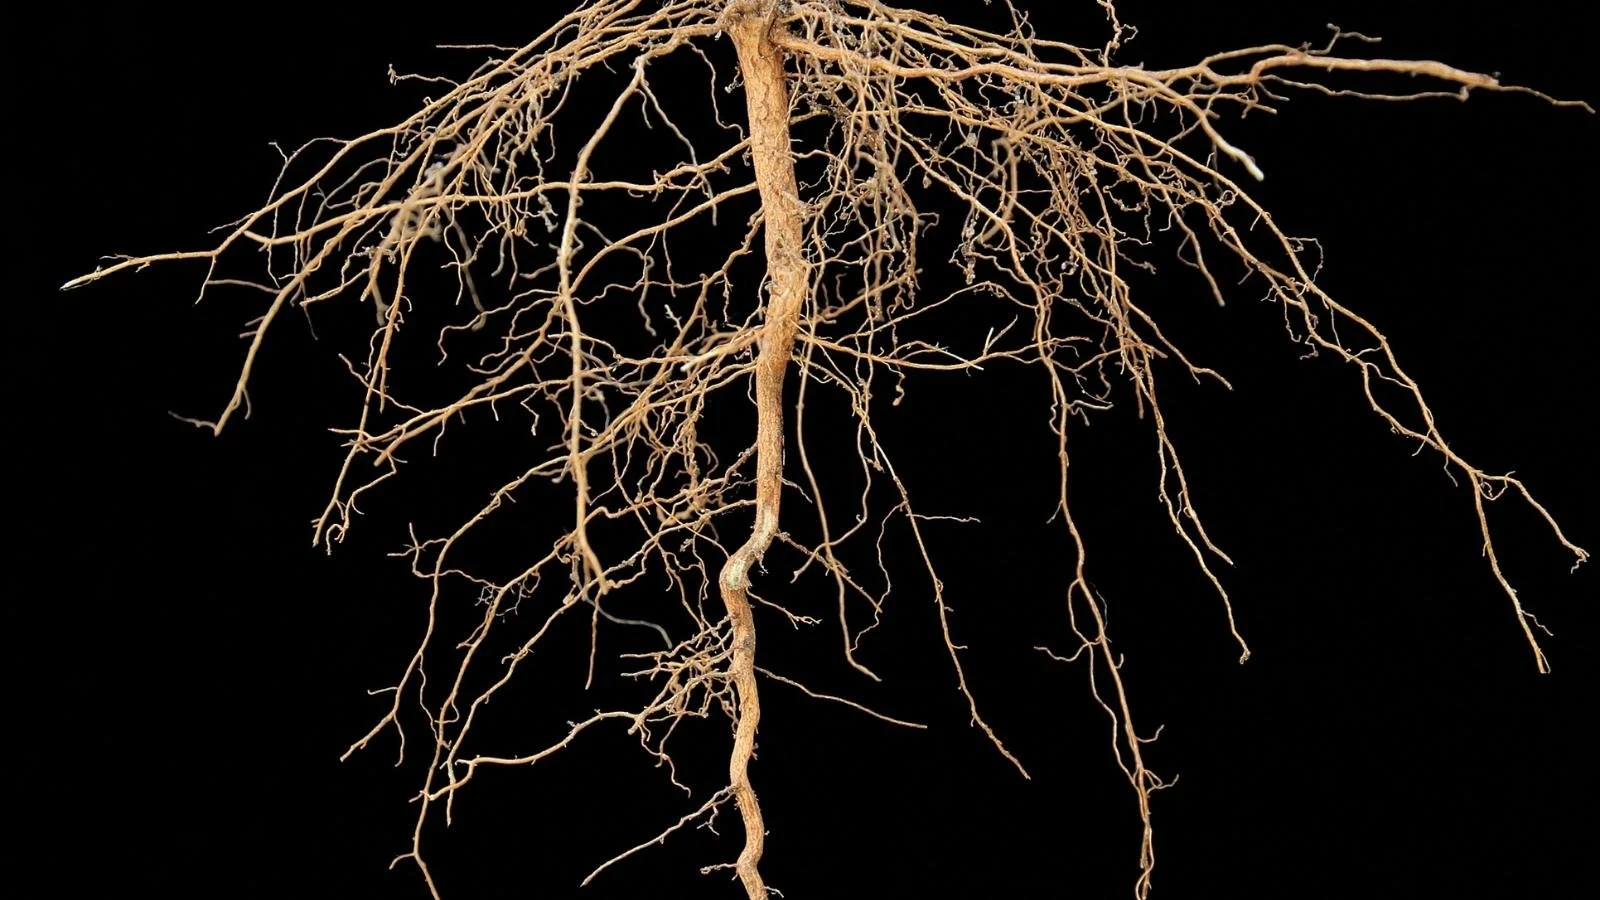
Root Development
Understanding how plants explore the soil for water and nutrients.
-
Soil Function
Understanding the environment where roots, water, nutrients and living processes interact.
-
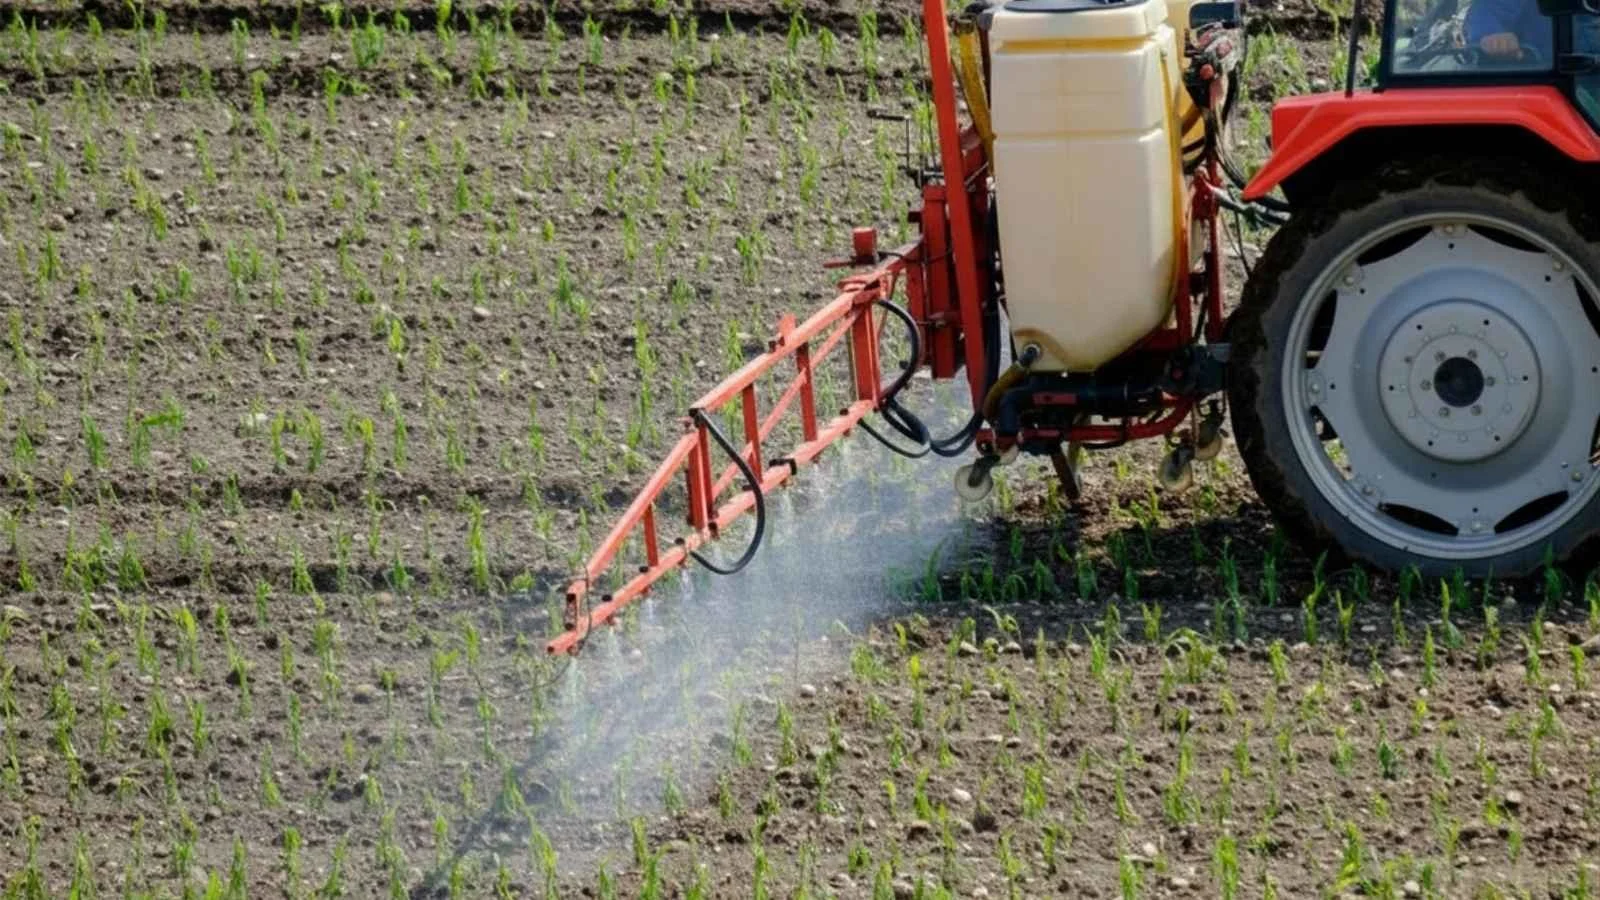
Nutrient Efficiency
Understanding how farming systems capture and use available nutrients.
-
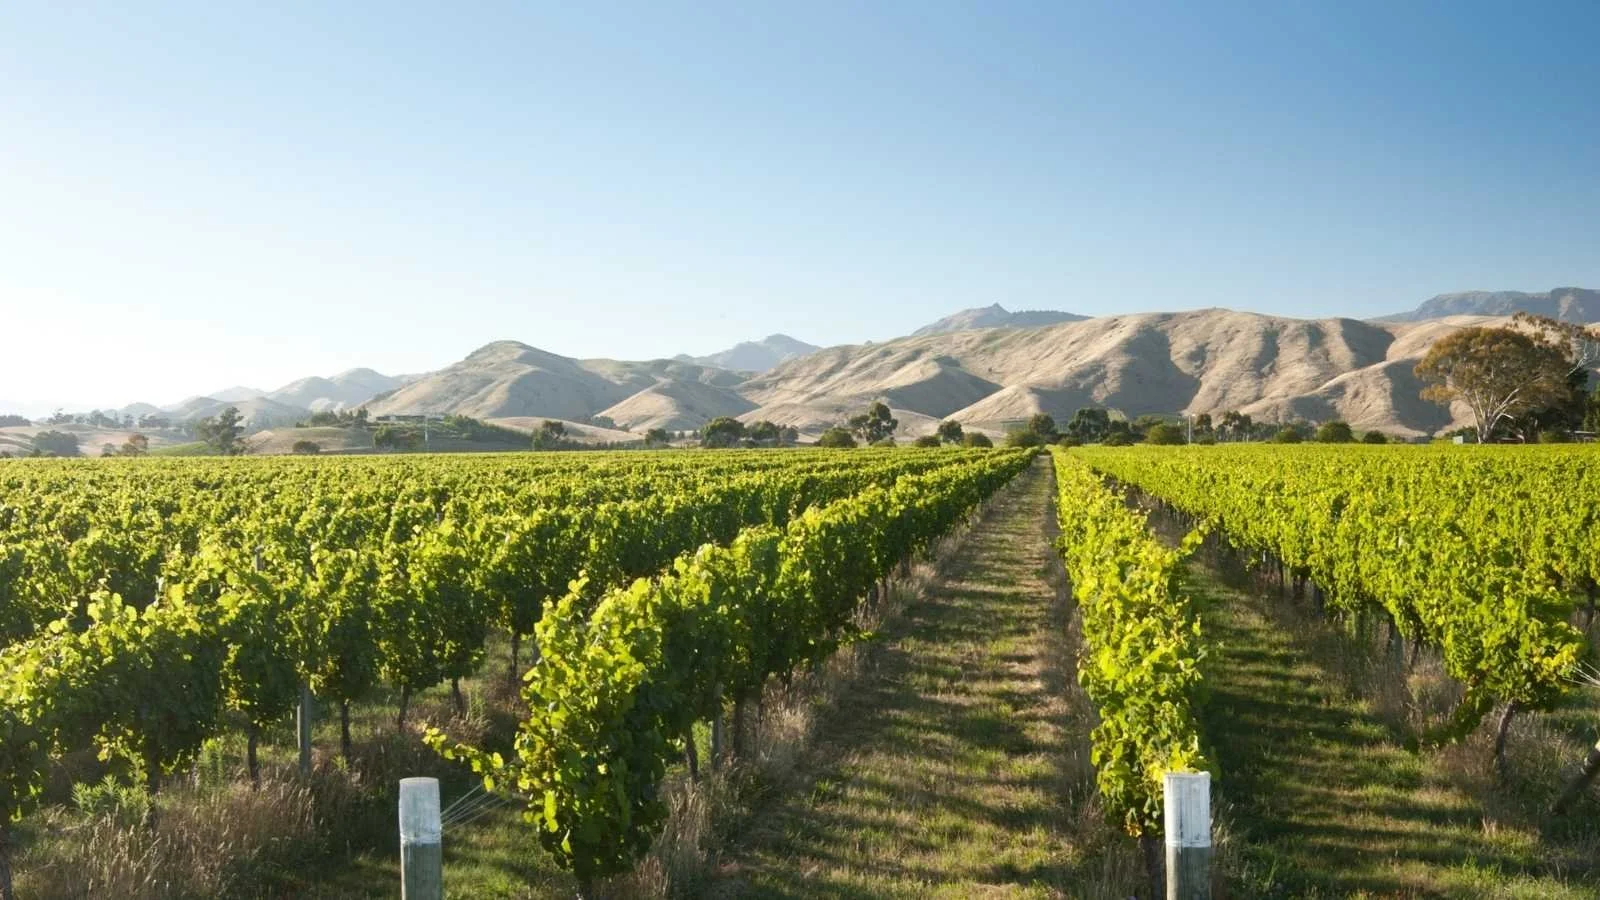
Plant Performance
Understanding how plants convert available resources into productive growth.